PROTECTED SOURCE SCRIPT
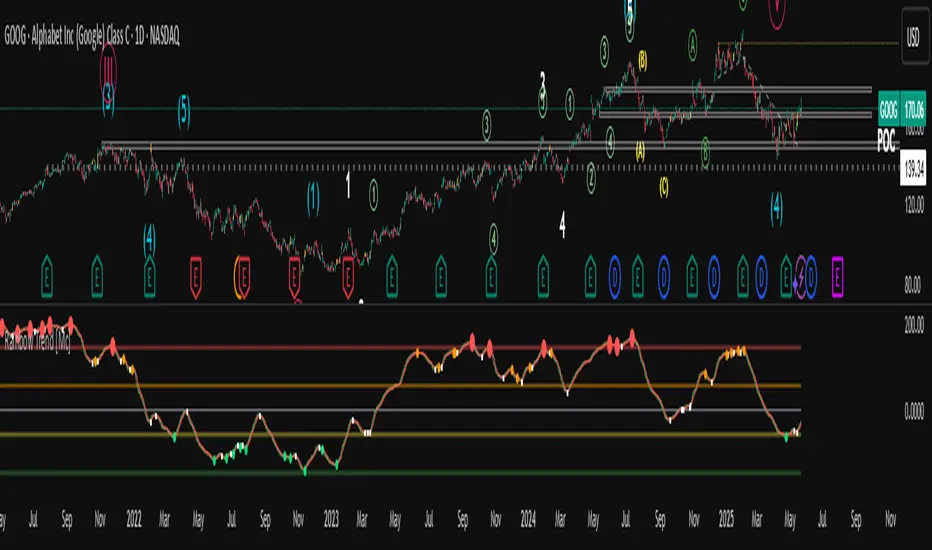
Rainbow Trend [Mc]
1. Momentum-Based Foundation
2. Long-Term Time Frame
3. Multicolored Gradient Lines
4. Horizontal Levels (Overbought/Oversold Zones)
5. Reversal Signal Markers
- This indicator measures the velocity and strength of price changes.
- Rising momentum indicates that price movement (upward or downward) has strength behind it.
- When momentum weakens or reverses, it often signals a potential trend reversal.
2. Long-Term Time Frame
- Unlike traditional indicators like RSI or Stochastic, which use shorter lookback periods (e.g., 14 days), this indicator uses a much longer period, such as 50 to 200 days.
- This extended range helps smooth out volatility and provides a clearer view of the primary trend.
3. Multicolored Gradient Lines
- The indicator displays multi-layered colored curves, often with a rainbow-like gradient.
- Red or pink areas indicate strong selling pressure or peak momentum in an uptrend.
- Green or bright green dots often suggest recovery or bottoming momentum.
- Orange or yellow colors indicate neutral or transition zones, awaiting trend confirmation.
4. Horizontal Levels (Overbought/Oversold Zones)
- The chart includes reference levels such as +160, 0, -40, and -120 (as shown in the image).
- These levels help identify when momentum is reaching overbought or oversold conditions.
- Reversals often begin near the upper or lower extremes of these zones.
5. Reversal Signal Markers
- Red dots at the top indicate extreme bullish momentum and potential topping zones.
- Green dots at the bottom suggest oversold conditions and potential bullish reversals.
보호된 스크립트입니다
이 스크립트는 비공개 소스로 게시됩니다. 하지만 이를 자유롭게 제한 없이 사용할 수 있습니다 – 자세한 내용은 여기에서 확인하세요.
면책사항
해당 정보와 게시물은 금융, 투자, 트레이딩 또는 기타 유형의 조언이나 권장 사항으로 간주되지 않으며, 트레이딩뷰에서 제공하거나 보증하는 것이 아닙니다. 자세한 내용은 이용 약관을 참조하세요.
면책사항
해당 정보와 게시물은 금융, 투자, 트레이딩 또는 기타 유형의 조언이나 권장 사항으로 간주되지 않으며, 트레이딩뷰에서 제공하거나 보증하는 것이 아닙니다. 자세한 내용은 이용 약관을 참조하세요.