PROTECTED SOURCE SCRIPT
업데이트됨 Double Fixed MAs

This is a version of my fixed MA script where 2 fixed MAs can be shown at once. Please see my "Fixed Moving Average" script for full explanation on what a fixed moving average is.
The defaults are the 12h 200 EMA and 12h 200 SMA. A strategy that can be used with these settings is as follows:
If price is caught in between the 2 moving averages, and is respecting them as support and resistance, then you can use a 12h candle close outside of the 2 MAs as a signal to long/short.
12h candle close above upper MA = look for longs
12h candle close below lower MA = look for shorts
Fully customizable.
As always, feel free to message me for any suggestions/questions.
Enjoy!
릴리즈 노트
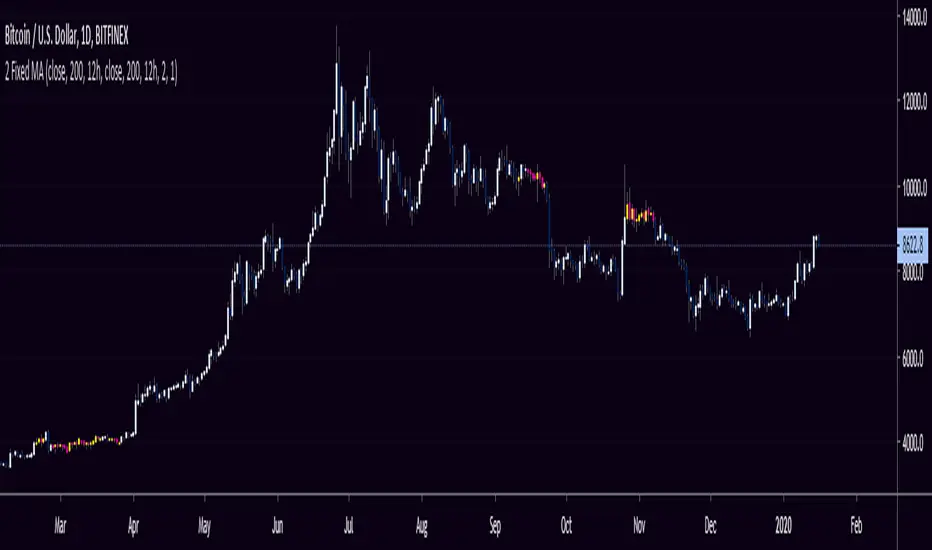
Updated the script so that the candle bar colors now change when the candles are range bound between the 2 MAs! This means you no longer need the MAs cluttering up the screen, and can wait for the candles to change color before you flip them back on. Now by default the MAs are hidden, but if you go into the settings menu and check the first box, it will flip them back on.FYI - definition of "range bound" in this case, is when the current resolution candles open and close are between both of the MAs. This is to help filter out some of the noise I was getting on different time frames from candles that were only closing within the range.
The candle color changes from whatever your default colors are, to Yellow = up candle and Pink = down candle. The colors should be editable in the settings menu as well!
Thanks, and don't hesitate to reach out with any questions or requests!
cheers
릴리즈 노트
Just updating the cover picture so that it removes the RSI and only displays this specific indicator (As per the TradingView rules).보호된 스크립트입니다
이 스크립트는 비공개 소스로 게시됩니다. 하지만 이를 자유롭게 제한 없이 사용할 수 있습니다 – 자세한 내용은 여기에서 확인하세요.
면책사항
해당 정보와 게시물은 금융, 투자, 트레이딩 또는 기타 유형의 조언이나 권장 사항으로 간주되지 않으며, 트레이딩뷰에서 제공하거나 보증하는 것이 아닙니다. 자세한 내용은 이용 약관을 참조하세요.
보호된 스크립트입니다
이 스크립트는 비공개 소스로 게시됩니다. 하지만 이를 자유롭게 제한 없이 사용할 수 있습니다 – 자세한 내용은 여기에서 확인하세요.
면책사항
해당 정보와 게시물은 금융, 투자, 트레이딩 또는 기타 유형의 조언이나 권장 사항으로 간주되지 않으며, 트레이딩뷰에서 제공하거나 보증하는 것이 아닙니다. 자세한 내용은 이용 약관을 참조하세요.