OPEN-SOURCE SCRIPT
업데이트됨 Daily RTH Moving Average On Intraday Timeframes [vnhilton]
This indicator is intended for intraday use from the daily timeframe down to the 1 minute. Outside this range, the indicator won't work as intended.
Higher timeframe moving averages are step-lines as they use values from higher timeframes to calculate the moving average. To have a smoother moving average from higher timeframes plotted on lower timeframes, this indicator uses the chart timeframe's candles, allowing for a smooth higher timeframe moving average. This indicator also includes Bollinger Bands. Note that the indicator only uses values from regular trading hours, as to not give weighting to values from extended trading hours.
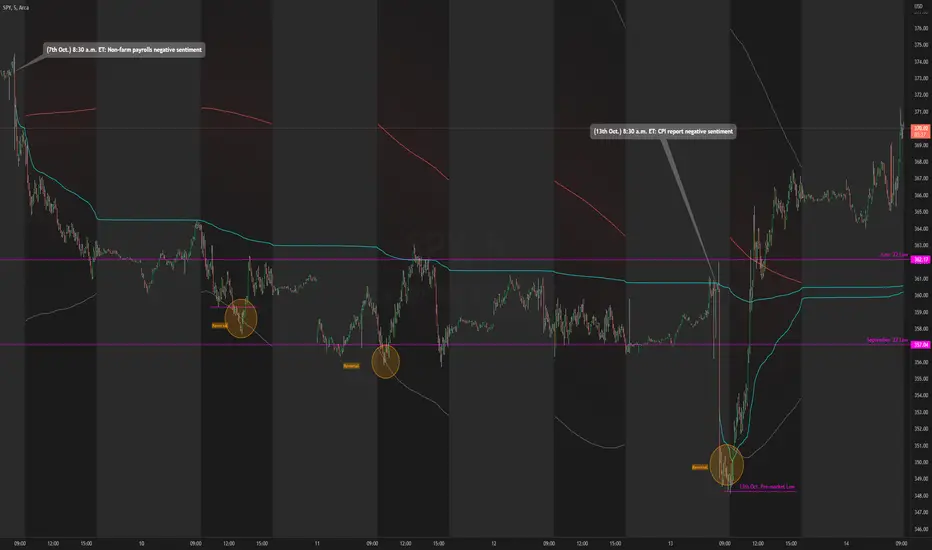
In the chart above, at October 7th, pre-market price action is bearish due to fundamentals around US employment data. This day led to an all-day-fader, stopping above the June low after attempting to break down the level again (previous breakdown attempts led to the September low). Note that the price is within the Bollinger bands of the 5 day moving average. We can see in the following days that SPY trended downwards, staying below the anchored VWAP when the October 7th news released, & pay attention to October 10th, where price attempts to make a new low-of-day but ends up outside the 5 day period ma, leading to a reversal. Look at October 13th, where pre-market price action again shows bearish sentiment, but due to fundamentals around CPI data. SPY opens below the September low, but also ends up outside the daily 5 period MA bands, meaning that the downside extension has extended too far, signalling for a reversion to the mean. This is why October 13th didn't lead to another all-day-fader, & instead trapped sellers trying to short the pre-market low, helping to fuel the relief rally to cause the upsides the June & September lows, & the anchored VWAPs from both significant pre-market events, to be reclaimed, where price pauses at the confluence of the 5 day moving average & the June low.
Higher timeframe moving averages are step-lines as they use values from higher timeframes to calculate the moving average. To have a smoother moving average from higher timeframes plotted on lower timeframes, this indicator uses the chart timeframe's candles, allowing for a smooth higher timeframe moving average. This indicator also includes Bollinger Bands. Note that the indicator only uses values from regular trading hours, as to not give weighting to values from extended trading hours.
In the chart above, at October 7th, pre-market price action is bearish due to fundamentals around US employment data. This day led to an all-day-fader, stopping above the June low after attempting to break down the level again (previous breakdown attempts led to the September low). Note that the price is within the Bollinger bands of the 5 day moving average. We can see in the following days that
릴리즈 노트
Fixed bollinger band calculations오픈 소스 스크립트
트레이딩뷰의 진정한 정신에 따라, 이 스크립트의 작성자는 이를 오픈소스로 공개하여 트레이더들이 기능을 검토하고 검증할 수 있도록 했습니다. 작성자에게 찬사를 보냅니다! 이 코드는 무료로 사용할 수 있지만, 코드를 재게시하는 경우 하우스 룰이 적용된다는 점을 기억하세요.
면책사항
해당 정보와 게시물은 금융, 투자, 트레이딩 또는 기타 유형의 조언이나 권장 사항으로 간주되지 않으며, 트레이딩뷰에서 제공하거나 보증하는 것이 아닙니다. 자세한 내용은 이용 약관을 참조하세요.
오픈 소스 스크립트
트레이딩뷰의 진정한 정신에 따라, 이 스크립트의 작성자는 이를 오픈소스로 공개하여 트레이더들이 기능을 검토하고 검증할 수 있도록 했습니다. 작성자에게 찬사를 보냅니다! 이 코드는 무료로 사용할 수 있지만, 코드를 재게시하는 경우 하우스 룰이 적용된다는 점을 기억하세요.
면책사항
해당 정보와 게시물은 금융, 투자, 트레이딩 또는 기타 유형의 조언이나 권장 사항으로 간주되지 않으며, 트레이딩뷰에서 제공하거나 보증하는 것이 아닙니다. 자세한 내용은 이용 약관을 참조하세요.