OPEN-SOURCE SCRIPT
Perfect Trend EMAs (9-21-50-100)
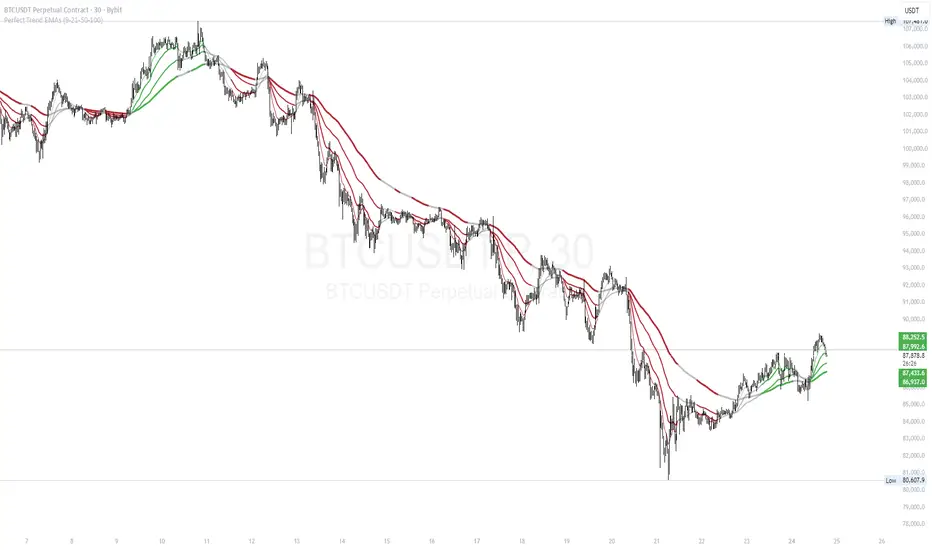
This indicator provides a clear, color-coded visual representation of trend strength based on the alignment of four Exponential Moving Averages (EMAs). It is designed to help traders identify "Perfect Trend" setups, where momentum is fully aligned across multiple timeframes, and filter out choppy or ranging markets.
How it Works (The Logic) The indicator plots four distinct EMAs (default lengths: 9, 21, 50, and 100). Instead of simply looking for crossovers, this script analyzes the hierarchical stacking of these averages to determine the market state.
The color coding follows these specific rules:
🟢 Bullish Alignment (Green): This occurs only when there is a "Perfect Bullish" stack.
Logic: EMA 9 > EMA 21 > EMA 50 > EMA 100
Interpretation: Short-term momentum is stronger than long-term momentum, indicating a strong uptrend.
🔴 Bearish Alignment (Red): This occurs only when there is a "Perfect Bearish" stack.
Logic: EMA 9 < EMA 21 < EMA 50 < EMA 100
Interpretation: Short-term momentum is weaker than long-term momentum, indicating a strong downtrend.
⚪ Consolidation / Transition (Gray):
Logic: Any other combination.
Interpretation: The moving averages are intertwined or not perfectly aligned. This usually signals a ranging market, a consolidation phase, or the early stages of a trend reversal before the alignment is confirmed.
Features
Dynamic Coloring: All EMA lines change color simultaneously to provide an instant visual signal of the market state.
Visual Fill: A soft background fill is applied between the fastest (9) and slowest (100) EMA to create a "Trend Cloud," making it easier to spot the expansion and contraction of the trend.
Customization: Users can adjust the lengths of all four EMAs in the settings menu to fit different trading styles (e.g., changing to 20/50/100/200).
How to Use
Trend Following: Traders can look for the lines to turn Green or Red to confirm a trend entry.
Filtering Noise: The Gray zones serve as a filter. If the lines are Gray, the trend is not fully established, suggesting caution or a "wait and see" approach.
Exits: A change from Green/Red back to Gray can act as an early warning sign that the trend momentum is fading.
오픈 소스 스크립트
트레이딩뷰의 진정한 정신에 따라, 이 스크립트의 작성자는 이를 오픈소스로 공개하여 트레이더들이 기능을 검토하고 검증할 수 있도록 했습니다. 작성자에게 찬사를 보냅니다! 이 코드는 무료로 사용할 수 있지만, 코드를 재게시하는 경우 하우스 룰이 적용된다는 점을 기억하세요.
면책사항
해당 정보와 게시물은 금융, 투자, 트레이딩 또는 기타 유형의 조언이나 권장 사항으로 간주되지 않으며, 트레이딩뷰에서 제공하거나 보증하는 것이 아닙니다. 자세한 내용은 이용 약관을 참조하세요.
오픈 소스 스크립트
트레이딩뷰의 진정한 정신에 따라, 이 스크립트의 작성자는 이를 오픈소스로 공개하여 트레이더들이 기능을 검토하고 검증할 수 있도록 했습니다. 작성자에게 찬사를 보냅니다! 이 코드는 무료로 사용할 수 있지만, 코드를 재게시하는 경우 하우스 룰이 적용된다는 점을 기억하세요.
면책사항
해당 정보와 게시물은 금융, 투자, 트레이딩 또는 기타 유형의 조언이나 권장 사항으로 간주되지 않으며, 트레이딩뷰에서 제공하거나 보증하는 것이 아닙니다. 자세한 내용은 이용 약관을 참조하세요.