OPEN-SOURCE SCRIPT
Stacked MAs and Solid Price Volume
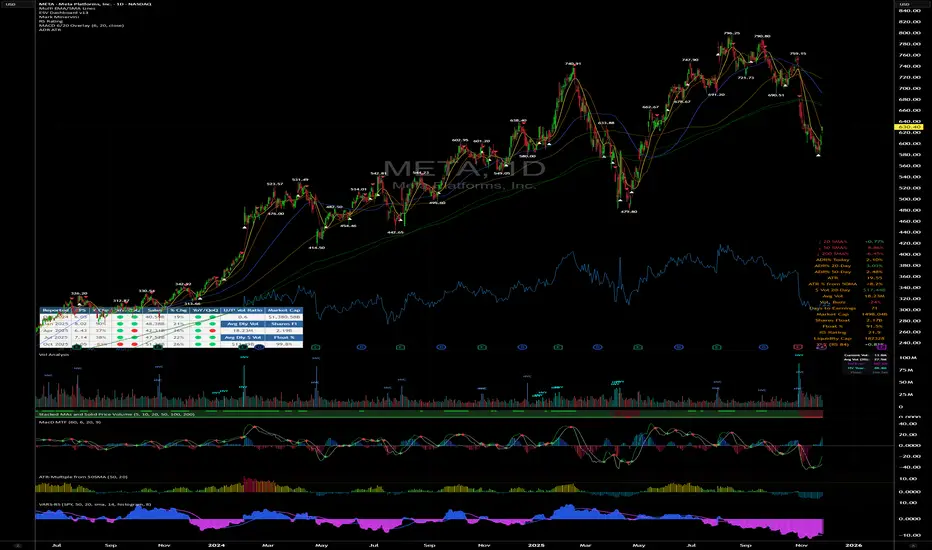
Stacked MAs and Solid Price Volume is a lower-pane trend alignment indicator that provides instant visual confirmation of moving average structure and price positioning. The indicator monitors all six key SMAs (5, 10, 20, 50, 100, and 200-day) and displays background shading based on trend health: light red when price trades below the 200 SMA (caution zone), light green when price is above the 200 SMA (bullish territory), and darker green when price is above the 200 SMA AND all SMAs are perfectly stacked in bullish order (5 > 10 > 20 > 50 > 100 > 200)—the ideal trending condition. A thick green horizontal line appears during periods of full stack alignment, making it easy to scan charts and identify sustained uptrends. Green dots at the bottom mark price crossovers above the 50 SMA (potential trend resumption signals), while white dots at the top flag 5/10 SMA bullish crossovers (short-term momentum shifts). The colored strip along the bottom displays the 200 SMA's trend direction: blue for rising, red for falling, and gray for flat—giving you immediate context on the long-term trend's trajectory. Smart IPO handling ensures the indicator works properly on newer stocks with limited price history by defaulting unavailable longer-term comparisons to neutral. Perfect for trend followers who want a quick, clean read on moving average alignment without cluttering their price chart.
오픈 소스 스크립트
트레이딩뷰의 진정한 정신에 따라, 이 스크립트의 작성자는 이를 오픈소스로 공개하여 트레이더들이 기능을 검토하고 검증할 수 있도록 했습니다. 작성자에게 찬사를 보냅니다! 이 코드는 무료로 사용할 수 있지만, 코드를 재게시하는 경우 하우스 룰이 적용된다는 점을 기억하세요.
면책사항
해당 정보와 게시물은 금융, 투자, 트레이딩 또는 기타 유형의 조언이나 권장 사항으로 간주되지 않으며, 트레이딩뷰에서 제공하거나 보증하는 것이 아닙니다. 자세한 내용은 이용 약관을 참조하세요.
오픈 소스 스크립트
트레이딩뷰의 진정한 정신에 따라, 이 스크립트의 작성자는 이를 오픈소스로 공개하여 트레이더들이 기능을 검토하고 검증할 수 있도록 했습니다. 작성자에게 찬사를 보냅니다! 이 코드는 무료로 사용할 수 있지만, 코드를 재게시하는 경우 하우스 룰이 적용된다는 점을 기억하세요.
면책사항
해당 정보와 게시물은 금융, 투자, 트레이딩 또는 기타 유형의 조언이나 권장 사항으로 간주되지 않으며, 트레이딩뷰에서 제공하거나 보증하는 것이 아닙니다. 자세한 내용은 이용 약관을 참조하세요.