OPEN-SOURCE SCRIPT
업데이트됨 ASG Delta %
This utility script provides a convenient way to calculate the percentage gain or drop of a token's price within a user-defined date range. It eliminates the need for manual measurement on individual charts, saving time and effort.
The script is particularly valuable when integrated into a daily token scanning routine for watchlists. By comparing the significant gains or drops among different tokens, traders can identify potential trading opportunities.
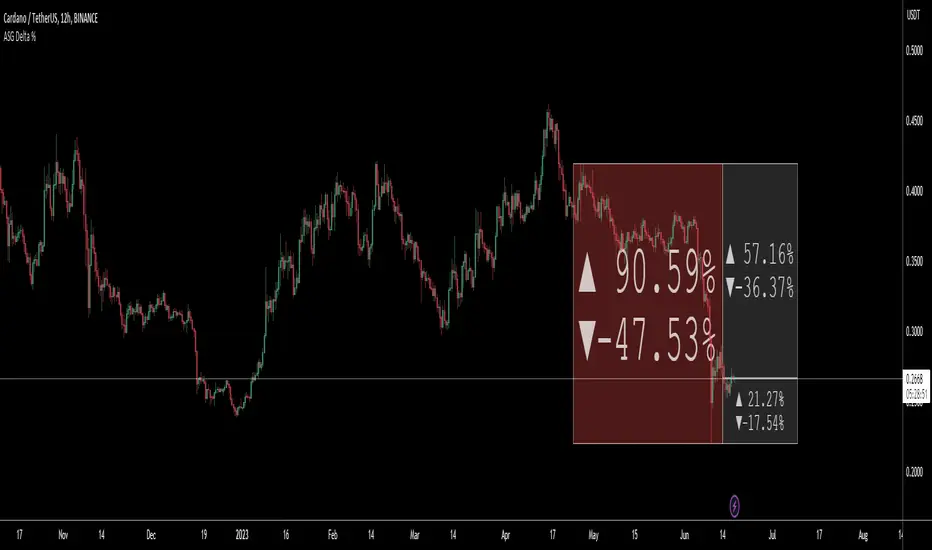
Simply select the desired date range, and the script will identify the highest and lowest price points achieved during that period. It then shows a visual representation in the form of a bullish or bearish box, displaying the percentage change (delta %). If the current price falls within the box's upper and lower bounds, additional percentage information can be shown in either the 'normal' or 'reverse' mode.
For instance, if a token experiences a -52.35% drop, enabling the 'Reverse' setting will reveal a potential 109.86% gain (from the low), or a 76.02% gain (from current price) or a potential drop of -16.5% (from current price) etc.. Having these basic statistics available, without having to manually chart them, especially during prolonged bear or bull markets, enables traders to make informed decisions and position themselves for more profitable trades.
I hope you find this script valuable. Your comments and recommendations are welcome as they will help improve the script's functionality further.


The script is particularly valuable when integrated into a daily token scanning routine for watchlists. By comparing the significant gains or drops among different tokens, traders can identify potential trading opportunities.
Simply select the desired date range, and the script will identify the highest and lowest price points achieved during that period. It then shows a visual representation in the form of a bullish or bearish box, displaying the percentage change (delta %). If the current price falls within the box's upper and lower bounds, additional percentage information can be shown in either the 'normal' or 'reverse' mode.
For instance, if a token experiences a -52.35% drop, enabling the 'Reverse' setting will reveal a potential 109.86% gain (from the low), or a 76.02% gain (from current price) or a potential drop of -16.5% (from current price) etc.. Having these basic statistics available, without having to manually chart them, especially during prolonged bear or bull markets, enables traders to make informed decisions and position themselves for more profitable trades.
I hope you find this script valuable. Your comments and recommendations are welcome as they will help improve the script's functionality further.
릴리즈 노트
1. Made some modifications to display both 'normal' and 'reverse' percentage changes at the same time2. Added some 'style' changes like "[BOX]" to display the extra deltas within a Box background - this allows the internal text to auto-resize
3. Some minor mods to allow you to display "arrows" or "%" signs if desired
4. Streamlined code
오픈 소스 스크립트
트레이딩뷰의 진정한 정신에 따라, 이 스크립트의 작성자는 이를 오픈소스로 공개하여 트레이더들이 기능을 검토하고 검증할 수 있도록 했습니다. 작성자에게 찬사를 보냅니다! 이 코드는 무료로 사용할 수 있지만, 코드를 재게시하는 경우 하우스 룰이 적용된다는 점을 기억하세요.
면책사항
해당 정보와 게시물은 금융, 투자, 트레이딩 또는 기타 유형의 조언이나 권장 사항으로 간주되지 않으며, 트레이딩뷰에서 제공하거나 보증하는 것이 아닙니다. 자세한 내용은 이용 약관을 참조하세요.
오픈 소스 스크립트
트레이딩뷰의 진정한 정신에 따라, 이 스크립트의 작성자는 이를 오픈소스로 공개하여 트레이더들이 기능을 검토하고 검증할 수 있도록 했습니다. 작성자에게 찬사를 보냅니다! 이 코드는 무료로 사용할 수 있지만, 코드를 재게시하는 경우 하우스 룰이 적용된다는 점을 기억하세요.
면책사항
해당 정보와 게시물은 금융, 투자, 트레이딩 또는 기타 유형의 조언이나 권장 사항으로 간주되지 않으며, 트레이딩뷰에서 제공하거나 보증하는 것이 아닙니다. 자세한 내용은 이용 약관을 참조하세요.