OPEN-SOURCE SCRIPT
Bollinger Bands %B Compare Vix
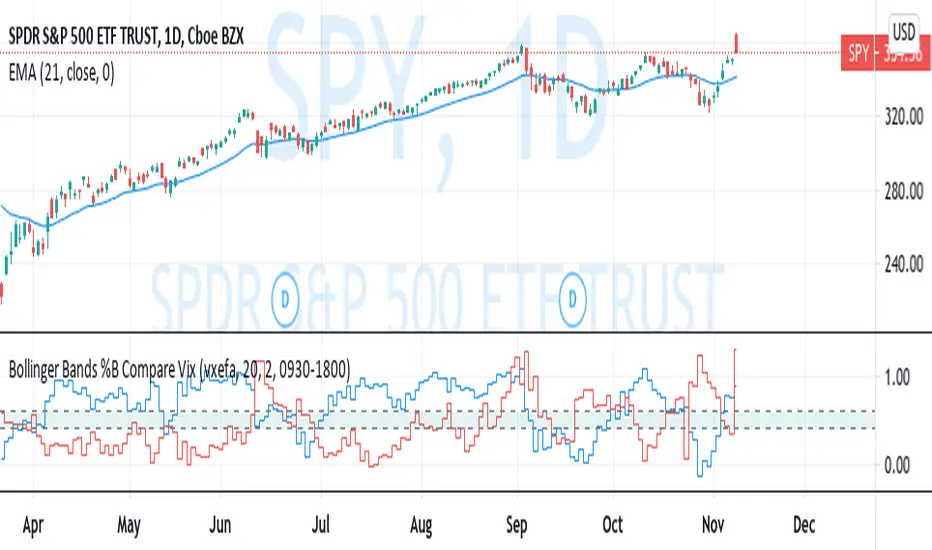
This imple script converts your chosen chart price and outputs it as a percentage in relation to the Vix percentage.
If price (Blue line) is higher than 0.60 and vix (Red Line) is lower than 0. 40 then there is lower volatility and this is good for buying.
If price (Blue line) is lower than 0. 40 and vix (Red Line) is higher than 0.60 then there is higher volatility and this is good for selling, exiting and cash only.
If you like risk you can enter as soon as the price and vix cross in either direction
This is my first script, please give me a lot of critique, I won't cry hahaha :)
For greater accuracy, you use these Vix products for their specific stocks/Indicies:
Apple - VVXAPL
Google - VVXGOG
Amazon - VVXAZN
IBM - VVXIBM
Goldman Sachs - VVXGS
NASDAQ 100 = VXN
VXN
SP100 - $CBOE:VXO
SP500 (3months) - VIX3M
VIX3M
XLE(energy sector) - $CBOE:VXXLE
EWZ(brazil etf) - VVXEWZ
EEM( emerging markets etf) -VVXEEM
EFA (MSCI ETF) - VVXEFA
FXI (Cina ETF) - VVXFXI
If price (Blue line) is higher than 0.60 and vix (Red Line) is lower than 0. 40 then there is lower volatility and this is good for buying.
If price (Blue line) is lower than 0. 40 and vix (Red Line) is higher than 0.60 then there is higher volatility and this is good for selling, exiting and cash only.
If you like risk you can enter as soon as the price and vix cross in either direction
This is my first script, please give me a lot of critique, I won't cry hahaha :)
For greater accuracy, you use these Vix products for their specific stocks/Indicies:
Apple - VVXAPL
Google - VVXGOG
Amazon - VVXAZN
IBM - VVXIBM
Goldman Sachs - VVXGS
NASDAQ 100 =
SP100 - $CBOE:VXO
SP500 (3months) -
XLE(energy sector) - $CBOE:VXXLE
EWZ(brazil etf) - VVXEWZ
EEM( emerging markets etf) -VVXEEM
EFA (MSCI ETF) - VVXEFA
FXI (Cina ETF) - VVXFXI
오픈 소스 스크립트
트레이딩뷰의 진정한 정신에 따라, 이 스크립트의 작성자는 이를 오픈소스로 공개하여 트레이더들이 기능을 검토하고 검증할 수 있도록 했습니다. 작성자에게 찬사를 보냅니다! 이 코드는 무료로 사용할 수 있지만, 코드를 재게시하는 경우 하우스 룰이 적용된다는 점을 기억하세요.
면책사항
해당 정보와 게시물은 금융, 투자, 트레이딩 또는 기타 유형의 조언이나 권장 사항으로 간주되지 않으며, 트레이딩뷰에서 제공하거나 보증하는 것이 아닙니다. 자세한 내용은 이용 약관을 참조하세요.
오픈 소스 스크립트
트레이딩뷰의 진정한 정신에 따라, 이 스크립트의 작성자는 이를 오픈소스로 공개하여 트레이더들이 기능을 검토하고 검증할 수 있도록 했습니다. 작성자에게 찬사를 보냅니다! 이 코드는 무료로 사용할 수 있지만, 코드를 재게시하는 경우 하우스 룰이 적용된다는 점을 기억하세요.
면책사항
해당 정보와 게시물은 금융, 투자, 트레이딩 또는 기타 유형의 조언이나 권장 사항으로 간주되지 않으며, 트레이딩뷰에서 제공하거나 보증하는 것이 아닙니다. 자세한 내용은 이용 약관을 참조하세요.