OPEN-SOURCE SCRIPT
MACD - STOCH - RSI
This indicator combines the
- MACD w/ Volume Conditions
- STOCHASTIC
- RSI
All into one place, to help find confluences between popular convergence / divergence indicators.
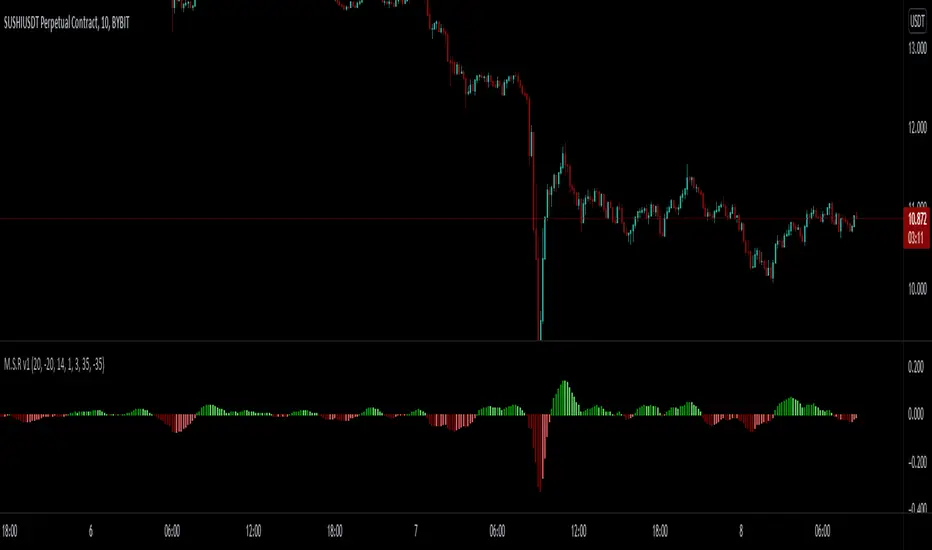
It's primary use is the histogram of the MACD.
The colors change whether or not the current bar is higher or lower than the previous.
Lighter shade signifies the bars are getting smaller.

You can also enable a feature which will change the color of the histogram depending on the volume.
There are 2 conditions which can be met which signify 'Increasing Volume' and 'Above Average Volume'.
If the MACD is above 0,
Light Blue signifies increasing volume.
Dark Blue signifies above average volume
If the MACD is below 0,
Light Purple signifies increasing volume.
Dark Purple signifies above average volume.
Having volume conditions within the histogram are meant to act as confluence. For example, if the histogram is
rising and light blue or dark blue bars are shown, this could hint towards a larger move to the upside if previous
upswings on the histogram were only green.
Increased volume near the peak of a move can also signify lots of orders coming into the market in hopes
of reversing the current trend or starting a correction.

formula:
Avg of volume over past 10 bars * 1.5 = increasing volume
Avg of volume over past 10 bars * 2 = Above Average Volume
--
The RSI and STOCHASTIC have been run through a custom function which moves the values. The middle line is now 0.
Where on most RSI and STOCHASTIC indicators the middle line can be considered 50, with overbought levels nearing 70
and oversold levels around 30.
On the M.S.R , the RSI overbought levels are by default 20, and oversold -20.
I've done this because for myself it was easier to understand RSI was becoming oversold if it went below 0, not 50.

The same function also applies to the STOCHASTIC indicator.

The RSI and STOCHASTIC can also be displayed together to help see the conditions of both indicators at once.

--
- MACD w/ Volume Conditions
- STOCHASTIC
- RSI
All into one place, to help find confluences between popular convergence / divergence indicators.
It's primary use is the histogram of the MACD.
The colors change whether or not the current bar is higher or lower than the previous.
Lighter shade signifies the bars are getting smaller.
You can also enable a feature which will change the color of the histogram depending on the volume.
There are 2 conditions which can be met which signify 'Increasing Volume' and 'Above Average Volume'.
If the MACD is above 0,
Light Blue signifies increasing volume.
Dark Blue signifies above average volume
If the MACD is below 0,
Light Purple signifies increasing volume.
Dark Purple signifies above average volume.
Having volume conditions within the histogram are meant to act as confluence. For example, if the histogram is
rising and light blue or dark blue bars are shown, this could hint towards a larger move to the upside if previous
upswings on the histogram were only green.
Increased volume near the peak of a move can also signify lots of orders coming into the market in hopes
of reversing the current trend or starting a correction.
formula:
Avg of volume over past 10 bars * 1.5 = increasing volume
Avg of volume over past 10 bars * 2 = Above Average Volume
--
The RSI and STOCHASTIC have been run through a custom function which moves the values. The middle line is now 0.
Where on most RSI and STOCHASTIC indicators the middle line can be considered 50, with overbought levels nearing 70
and oversold levels around 30.
On the M.S.R , the RSI overbought levels are by default 20, and oversold -20.
I've done this because for myself it was easier to understand RSI was becoming oversold if it went below 0, not 50.
The same function also applies to the STOCHASTIC indicator.
The RSI and STOCHASTIC can also be displayed together to help see the conditions of both indicators at once.
--
오픈 소스 스크립트
트레이딩뷰의 진정한 정신에 따라, 이 스크립트의 작성자는 이를 오픈소스로 공개하여 트레이더들이 기능을 검토하고 검증할 수 있도록 했습니다. 작성자에게 찬사를 보냅니다! 이 코드는 무료로 사용할 수 있지만, 코드를 재게시하는 경우 하우스 룰이 적용된다는 점을 기억하세요.
면책사항
해당 정보와 게시물은 금융, 투자, 트레이딩 또는 기타 유형의 조언이나 권장 사항으로 간주되지 않으며, 트레이딩뷰에서 제공하거나 보증하는 것이 아닙니다. 자세한 내용은 이용 약관을 참조하세요.
오픈 소스 스크립트
트레이딩뷰의 진정한 정신에 따라, 이 스크립트의 작성자는 이를 오픈소스로 공개하여 트레이더들이 기능을 검토하고 검증할 수 있도록 했습니다. 작성자에게 찬사를 보냅니다! 이 코드는 무료로 사용할 수 있지만, 코드를 재게시하는 경우 하우스 룰이 적용된다는 점을 기억하세요.
면책사항
해당 정보와 게시물은 금융, 투자, 트레이딩 또는 기타 유형의 조언이나 권장 사항으로 간주되지 않으며, 트레이딩뷰에서 제공하거나 보증하는 것이 아닙니다. 자세한 내용은 이용 약관을 참조하세요.