PROTECTED SOURCE SCRIPT
Dynamic Multi-Timeframe Moving Averages Matrix [CdeCripto]
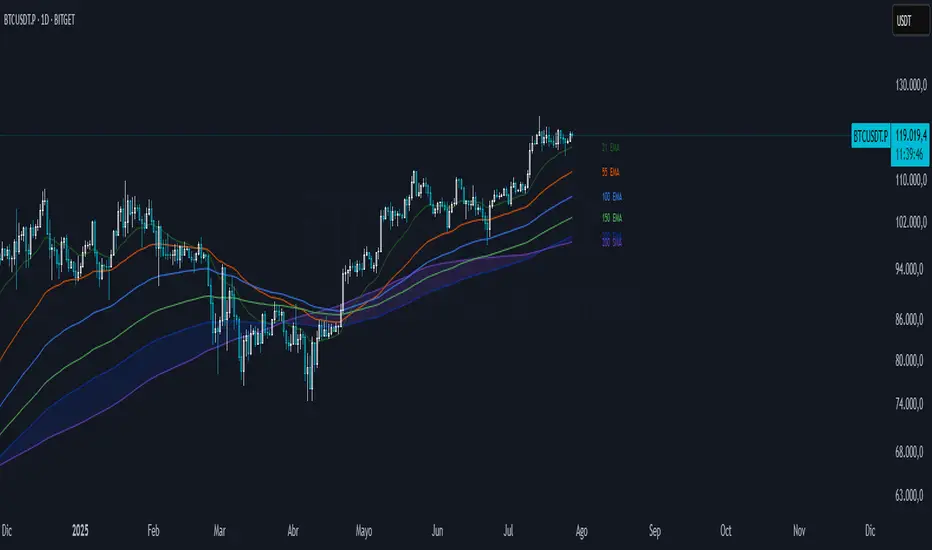
This indicator plots up to 10 customizable moving averages (EMA or SMA) from different timeframes on your chart, with optional colored fills and labels. Perfect for traders who want a clear, consolidated view of multiple trend signals at once.
Key Features
Up to 10 MAs: Independently toggle visibility, length, timeframe and type (EMA/SMA) for each moving average.
Multi-Timeframe Support: Fetches data via request.security, letting you overlay higher- or lower-frame MAs on any chart.
Conditional Fills: Optional translucent fills between adjacent MAs to highlight relative strength—green when the faster MA is above, red when below.
Dynamic Labels: On-chart text boxes showing MA length, period and type—fully configurable colour and size for quick reference.
Clean, Lightweight Code: Highly commented and optimized for performance; minimal risk of hitting TradingView’s line/label limits.
Inputs
MA Visibility: Show/hide each of the 10 moving averages.
Length & Type: Set period (e.g. 50, 200) and choose EMA or SMA.
Timeframe: Specify any built-in or custom timeframe (e.g. 1h, 4h, D, W, M).
Colour & Style: Pick distinct colours for each MA; adjust line width and style.
Fill Options: Toggle fills between MA1–MA2, MA2–MA3, … MA9–MA10 and set fill transparency.
Label Options: Turn labels on/off, override label colour, choose font size.
Usage
Scan multiple trend horizons at a glance—ideal for strategies that combine short, medium and long-term moving average signals.
Spot regime changes: when a shorter‐term MA crosses above/below a longer-term MA, the colored fill instantly highlights the shift.
Keep your chart tidy: show only the MAs and fills you need, hide the rest.
How to Add
Copy the Pine Script code into a new indicator in TradingView’s Pine Editor.
Click “Add to Chart.”
Open the settings panel to customize each MA, fills, and labels.
Disclaimer: For educational purposes only. Not financial advice.
보호된 스크립트입니다
이 스크립트는 비공개 소스로 게시됩니다. 하지만 이를 자유롭게 제한 없이 사용할 수 있습니다 – 자세한 내용은 여기에서 확인하세요.
면책사항
해당 정보와 게시물은 금융, 투자, 트레이딩 또는 기타 유형의 조언이나 권장 사항으로 간주되지 않으며, 트레이딩뷰에서 제공하거나 보증하는 것이 아닙니다. 자세한 내용은 이용 약관을 참조하세요.
면책사항
해당 정보와 게시물은 금융, 투자, 트레이딩 또는 기타 유형의 조언이나 권장 사항으로 간주되지 않으며, 트레이딩뷰에서 제공하거나 보증하는 것이 아닙니다. 자세한 내용은 이용 약관을 참조하세요.