PROTECTED SOURCE SCRIPT
TT Historical Ranges
Beta - Ongoing Updates
Used to overlay the Open and Close prices and trading range for Last Daily, Weekly and Monthly Candle on your own charts and timeframes.
In the example shown
Indicator Settings - Daily, Weekly, Monthly and User Selected plots have their own display and style options.
NOTE: used for my own educational purposes and is not fit for trading advice or strategies.
Used to overlay the Open and Close prices and trading range for Last Daily, Weekly and Monthly Candle on your own charts and timeframes.
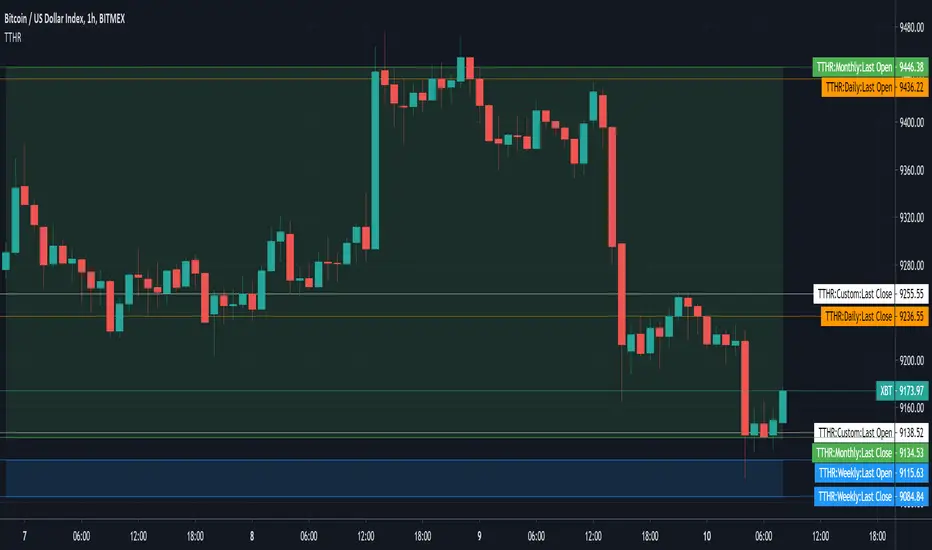
In the example shown
- the green area is showing the last Monthly Candle open and close range [price lines : on | historical fill range : on]
- the blue area at the bottom is showing the last Weekly Candle open and close range [price lines : on | historical fill range : on]
- the remaining horizontal are for the last Daily Candle (orange lines) and the User Selected Candle of 3 Days (white lines). [price lines : on | historical fill range : off]
- NOTE: the labels next to the scale for each price line are only visible if you turn on indicator labels in the scale settings.
Indicator Settings - Daily, Weekly, Monthly and User Selected plots have their own display and style options.
- enable or disable last open price line
- enable or disable last close price line
- enable or disable historical trading range (fill between open/close)
- select and your own preferred time frame to display
NOTE: used for my own educational purposes and is not fit for trading advice or strategies.
보호된 스크립트입니다
이 스크립트는 비공개 소스로 게시됩니다. 하지만 이를 자유롭게 제한 없이 사용할 수 있습니다 – 자세한 내용은 여기에서 확인하세요.
면책사항
해당 정보와 게시물은 금융, 투자, 트레이딩 또는 기타 유형의 조언이나 권장 사항으로 간주되지 않으며, 트레이딩뷰에서 제공하거나 보증하는 것이 아닙니다. 자세한 내용은 이용 약관을 참조하세요.
면책사항
해당 정보와 게시물은 금융, 투자, 트레이딩 또는 기타 유형의 조언이나 권장 사항으로 간주되지 않으며, 트레이딩뷰에서 제공하거나 보증하는 것이 아닙니다. 자세한 내용은 이용 약관을 참조하세요.