OPEN-SOURCE SCRIPT
업데이트됨 TR High/Low meter
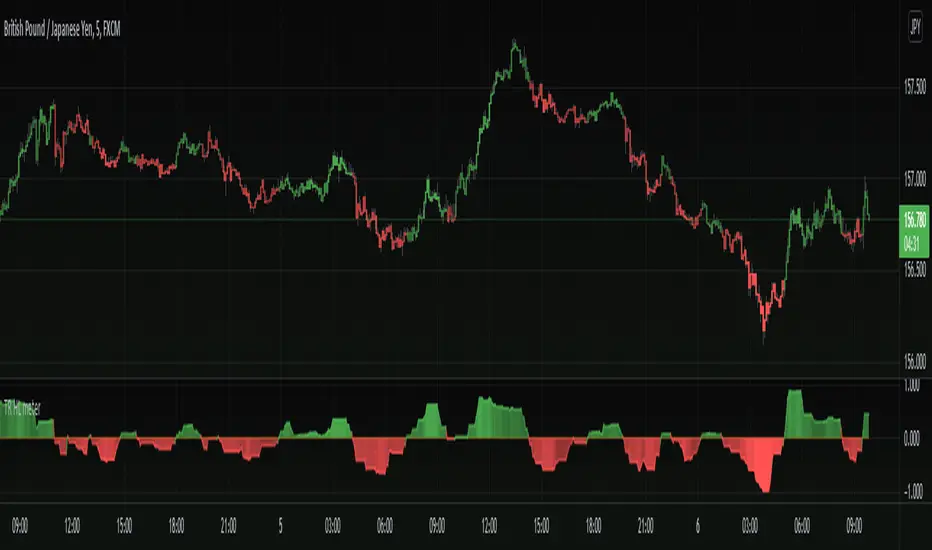
Interesting take for a velocity and trend analysis indicator, I call it The TR high/low meter.
First it will find the highest high and lowest low based on X bars back.
Now comes the twist, instead of storing these lowest or highest prices, we store the TR (true range) into the appropriate array (one array for lowest and one array for highest).
Finally, we sum up these two arrays for highest TR's and lowest TR's and subtract each other to get the difference, Hench, see who is stronger.
In the end we plot the difference into the indicator we have here.
The plot is colored with gradient color in which bright color emphasizes the movement is strong and weaker color emphasizes the movement is getting weaker.
Basically this indicator shows us the asset trend direction and strength. Awesome!
==Colors and Bar Colors==
Green: Up Trending
Light Green: Weakening up trend
Red: Down Trending.
Light Red: Weakening Down Trending.
==Notes==
Bar coloring is enabled on this chart!
Supports EMA smoothing (disabled by default)
Like if you like and Enjoy! Follow for more upcoming indicators/strategies: tradingview.com/u/dman103/
릴리즈 노트
Added alerts, Buy, Sell, and Natural (inside trade zone area)Added No trade zone range in which alerts will not trigger.
'No Trade zone' is visualized by white dots and borderlines.
The No-Trade zone is a zone where Buy and Sell alerts will NOT trigger (Note: disabled by default in settings).
Screenshot of 'no-trade zone':
릴리즈 노트
Update to version 6 of pinescript.Improved logic to one array instead of two arrays.
Added new plot to external filtering.
Added multi-time frame support.
Minor fixes.
오픈 소스 스크립트
트레이딩뷰의 진정한 정신에 따라, 이 스크립트의 작성자는 이를 오픈소스로 공개하여 트레이더들이 기능을 검토하고 검증할 수 있도록 했습니다. 작성자에게 찬사를 보냅니다! 이 코드는 무료로 사용할 수 있지만, 코드를 재게시하는 경우 하우스 룰이 적용된다는 점을 기억하세요.
Appreciation of my work: paypal.me/dman103
All Premium indicators: algo.win
LIVE Stream - Pivot Points Algo: youtube.com/channel/UCFyqab-i0xb2jf-c18ufH0A/live
All Premium indicators: algo.win
LIVE Stream - Pivot Points Algo: youtube.com/channel/UCFyqab-i0xb2jf-c18ufH0A/live
면책사항
해당 정보와 게시물은 금융, 투자, 트레이딩 또는 기타 유형의 조언이나 권장 사항으로 간주되지 않으며, 트레이딩뷰에서 제공하거나 보증하는 것이 아닙니다. 자세한 내용은 이용 약관을 참조하세요.