OPEN-SOURCE SCRIPT
업데이트됨 Elliott Wave Oscillator with Peak Detection
The Elliott Wave Oscillator with Derivative Peak Detection and Breakout Bands is a technical indicator that blends traditional Elliott Wave theory with modern derivative-based peak detection and breakout bands for a clearer view of market trends.
Key Components:
Elliott Wave Oscillator (EWO):
The core of the indicator is based on the difference between two simple moving averages (SMA): a short-term SMA (default length: 5) and a long-term SMA (default length: 35).
This difference is expressed either as an absolute value or a percentage of the current price, depending on the user’s input.
Smoothing:
The EWO is smoothed using an Exponential Moving Average (EMA) to filter out noise and provide a clearer trend direction.
The smoothing length is adaptive based on the current chart's timeframe (e.g., longer smoothing for daily charts).
Derivative Peak Detection:
The smoothed EWO is analyzed for peaks (positive) and troughs (negative) by calculating the derivative (rate of change) between consecutive values.
Peaks are detected when the derivative transitions from positive to negative, while troughs are identified when the derivative switches from negative to positive.
Tolerance levels are adjustable and vary by timeframe to avoid false signals.
Breakout Bands:
Upper and lower breakout bands are dynamically generated based on the smoothed EWO.
The bands help to filter significant peaks and troughs, only highlighting those that occur beyond the breakout levels.
Users can choose to display these bands and use them to filter out less significant peaks and troughs.
Visualization:
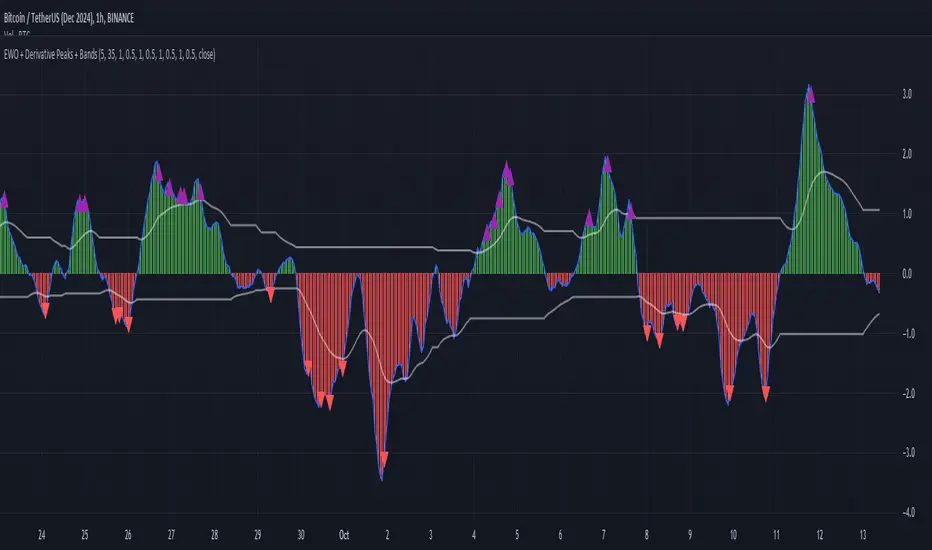
The original, unsmoothed EWO is plotted as a histogram, with positive values in green and negative values in red.
The smoothed EWO is plotted as a blue line, providing a clearer view of the underlying trend.
The breakout bands, if enabled, are plotted as white lines to visualize the upper and lower bounds of the oscillator's movement.
Positive peaks and negative troughs that meet the filtering criteria are marked with purple triangles (for peaks) and red triangles (for troughs) on the chart.
Customization Options:
Timeframe-based Smoothing and Tolerance: Different smoothing lengths and tolerance levels can be set for daily, hourly, and 5-minute charts.
Breakout Bands: Users can toggle the display of breakout bands and adjust their visual properties.
Peak Filtering: Peaks and troughs can be filtered based on whether they break out beyond the bands, or all peaks can be shown.
This indicator provides a unique blend of trend detection through the Elliott Wave Oscillator and derivative analysis to highlight significant market reversals while offering breakout bands as a filtering mechanism for false signals.
Key Components:
Elliott Wave Oscillator (EWO):
The core of the indicator is based on the difference between two simple moving averages (SMA): a short-term SMA (default length: 5) and a long-term SMA (default length: 35).
This difference is expressed either as an absolute value or a percentage of the current price, depending on the user’s input.
Smoothing:
The EWO is smoothed using an Exponential Moving Average (EMA) to filter out noise and provide a clearer trend direction.
The smoothing length is adaptive based on the current chart's timeframe (e.g., longer smoothing for daily charts).
Derivative Peak Detection:
The smoothed EWO is analyzed for peaks (positive) and troughs (negative) by calculating the derivative (rate of change) between consecutive values.
Peaks are detected when the derivative transitions from positive to negative, while troughs are identified when the derivative switches from negative to positive.
Tolerance levels are adjustable and vary by timeframe to avoid false signals.
Breakout Bands:
Upper and lower breakout bands are dynamically generated based on the smoothed EWO.
The bands help to filter significant peaks and troughs, only highlighting those that occur beyond the breakout levels.
Users can choose to display these bands and use them to filter out less significant peaks and troughs.
Visualization:
The original, unsmoothed EWO is plotted as a histogram, with positive values in green and negative values in red.
The smoothed EWO is plotted as a blue line, providing a clearer view of the underlying trend.
The breakout bands, if enabled, are plotted as white lines to visualize the upper and lower bounds of the oscillator's movement.
Positive peaks and negative troughs that meet the filtering criteria are marked with purple triangles (for peaks) and red triangles (for troughs) on the chart.
Customization Options:
Timeframe-based Smoothing and Tolerance: Different smoothing lengths and tolerance levels can be set for daily, hourly, and 5-minute charts.
Breakout Bands: Users can toggle the display of breakout bands and adjust their visual properties.
Peak Filtering: Peaks and troughs can be filtered based on whether they break out beyond the bands, or all peaks can be shown.
This indicator provides a unique blend of trend detection through the Elliott Wave Oscillator and derivative analysis to highlight significant market reversals while offering breakout bands as a filtering mechanism for false signals.
릴리즈 노트
The Elliott Wave Oscillator with Derivative Peak Detection and Breakout Bands is a technical indicator that blends traditional Elliott Wave theory with modern derivative-based peak detection and breakout bands for a clearer view of market trends.Key Components:
Elliott Wave Oscillator (EWO):
The core of the indicator is based on the difference between two simple moving averages (SMA): a short-term SMA (default length: 5) and a long-term SMA (default length: 35).
This difference is expressed either as an absolute value or a percentage of the current price, depending on the user’s input.
Smoothing:
The EWO is smoothed using an Exponential Moving Average (EMA) to filter out noise and provide a clearer trend direction.
The smoothing length is adaptive based on the current chart's timeframe (e.g., longer smoothing for daily charts).
Derivative Peak Detection:
The smoothed EWO is analyzed for peaks (positive) and troughs (negative) by calculating the derivative (rate of change) between consecutive values.
Peaks are detected when the derivative transitions from positive to negative, while troughs are identified when the derivative switches from negative to positive.
Tolerance levels are adjustable and vary by timeframe to avoid false signals.
Breakout Bands:
Upper and lower breakout bands are dynamically generated based on the smoothed EWO.
The bands help to filter significant peaks and troughs, only highlighting those that occur beyond the breakout levels.
Users can choose to display these bands and use them to filter out less significant peaks and troughs.
Visualization:
The original, unsmoothed EWO is plotted as a histogram, with positive values in green and negative values in red.
The smoothed EWO is plotted as a blue line, providing a clearer view of the underlying trend.
The breakout bands, if enabled, are plotted as white lines to visualize the upper and lower bounds of the oscillator's movement.
Positive peaks and negative troughs that meet the filtering criteria are marked with purple triangles (for peaks) and red triangles (for troughs) on the chart.
Customization Options:
Timeframe-based Smoothing and Tolerance: Different smoothing lengths and tolerance levels can be set for daily, hourly, and 5-minute charts.
Breakout Bands: Users can toggle the display of breakout bands and adjust their visual properties.
Peak Filtering: Peaks and troughs can be filtered based on whether they break out beyond the bands, or all peaks can be shown.
This indicator provides a unique blend of trend detection through the Elliott Wave Oscillator and derivative analysis to highlight significant market reversals while offering breakout bands as a filtering mechanism for false signals.
오픈 소스 스크립트
트레이딩뷰의 진정한 정신에 따라, 이 스크립트의 작성자는 이를 오픈소스로 공개하여 트레이더들이 기능을 검토하고 검증할 수 있도록 했습니다. 작성자에게 찬사를 보냅니다! 이 코드는 무료로 사용할 수 있지만, 코드를 재게시하는 경우 하우스 룰이 적용된다는 점을 기억하세요.
면책사항
해당 정보와 게시물은 금융, 투자, 트레이딩 또는 기타 유형의 조언이나 권장 사항으로 간주되지 않으며, 트레이딩뷰에서 제공하거나 보증하는 것이 아닙니다. 자세한 내용은 이용 약관을 참조하세요.
오픈 소스 스크립트
트레이딩뷰의 진정한 정신에 따라, 이 스크립트의 작성자는 이를 오픈소스로 공개하여 트레이더들이 기능을 검토하고 검증할 수 있도록 했습니다. 작성자에게 찬사를 보냅니다! 이 코드는 무료로 사용할 수 있지만, 코드를 재게시하는 경우 하우스 룰이 적용된다는 점을 기억하세요.
면책사항
해당 정보와 게시물은 금융, 투자, 트레이딩 또는 기타 유형의 조언이나 권장 사항으로 간주되지 않으며, 트레이딩뷰에서 제공하거나 보증하는 것이 아닙니다. 자세한 내용은 이용 약관을 참조하세요.