OPEN-SOURCE SCRIPT
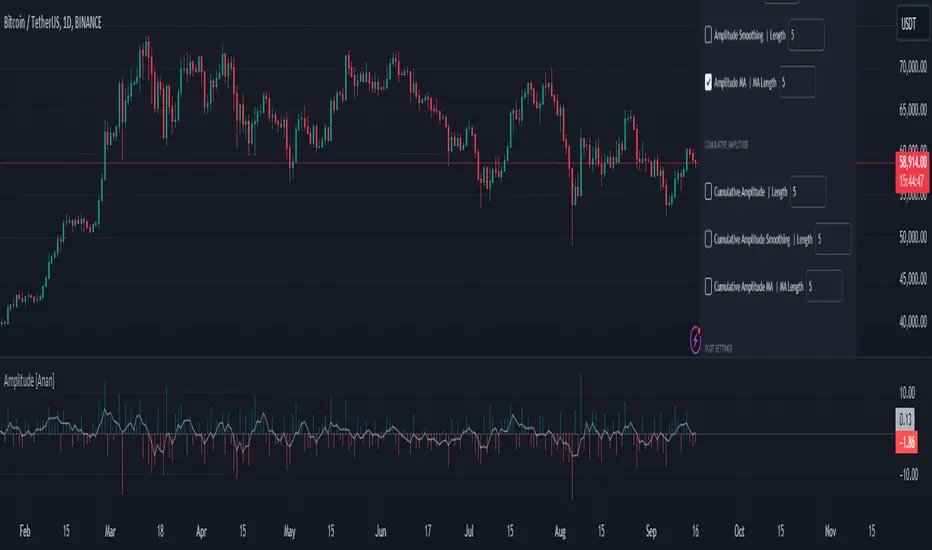
Amplitude [Anan]

The Amplitude [Anan] indicator calculates and visualizes both the amplitude and cumulative amplitude of price movements, providing traders with insights into price volatility and trend strength. By distinguishing between positive and negative amplitude movements, this indicator aids in identifying bullish and bearish sentiments, potential reversal points, and confirming trend directions.
█ Main Formulas
‣ Amplitude = High - Low
‣ Cumulative Amplitude = sum of Amplitude over the specified lookback period
‣ Percentage Amplitude = (Amplitude / Open) × 100%
█ Key Features
✦Dual Amplitude Calculations:
Amplitude: Reflects price range and direction over a short-term period.
Cumulative Amplitude: Aggregates amplitude over a longer period for broader trend analysis.
✦Customizable Parameters: Adjust lookback periods, smoothing options, moving averages and Alerts.
✦Direction Separation: Distinguish between positive and negative amplitude movements to identify market sentiment.
✦Flexible Visualization: Customizable colors and plot styles for enhanced chart readability.
✦Alert System: Generate signals based on amplitude direction and moving average crossovers
█ How to Use and Interpret
✦Understanding Amplitude and Cumulative Amplitude:
‣Amplitude: Measures the price range (high - low) over a specified short-term period.
‣Cumulative Amplitude: Aggregates amplitude over a defined longer-term period.
‣Percentage Representation: shows amplitude relative to the open price from `amp_length` bars ago, providing a normalized view.
‣Interpretation:
Large Amplitude Values: Indicate high volatility.
Small Amplitude Values: Indicate low volatility.
✦Trend Identification:
‣Uptrend: Consistently positive amplitudes and upward-moving averages.
‣Downtrend: Consistently negative amplitudes and downward-moving averages.
✦Overbought/Oversold Conditions:
‣High Positive Amplitude: May indicate overbought conditions and potential reversals.
‣High Negative Amplitude: May indicate oversold conditions and potential reversals.
✦Volatility Analysis:
‣High Amplitude Values: Suggest increased market volatility.
‣Low Amplitude Values: Suggest reduced market volatility.
✦Signal Confirmation:
‣Moving Average Crossovers: Confirm the strength and direction of trends, aiding in informed trading decisions.
✦Trading Strategies:
‣ Breakout Trading: Large increases in amplitude can signal potential breakouts.
‣ Mean Reversion: Extreme amplitude values may indicate upcoming price corrections.
‣ Volatility-Based Strategies: Adjust position sizes or trading frequency based on amplitude magnitudes.
‣ Multi-Timeframe Analysis: Compare amplitudes across different timeframes for a comprehensive market view.
█ Customization Tips
‣ Lookback Periods: Experiment with different periods to suit your trading style and asset characteristics.
‣ Smoothing Settings: Adjust to balance responsiveness and noise reduction.
‣ Percentage Amplitude: Use for normalized comparisons across different price levels.
█ Main Formulas
‣ Amplitude = High - Low
‣ Cumulative Amplitude = sum of Amplitude over the specified lookback period
‣ Percentage Amplitude = (Amplitude / Open) × 100%
- High: Candle high (or highest high when lookback > 1)
- Low: Candle low (or lowest low when lookback > 1)
- Open: Open price of the first candle in the lookback period
█ Key Features
✦Dual Amplitude Calculations:
Amplitude: Reflects price range and direction over a short-term period.
Cumulative Amplitude: Aggregates amplitude over a longer period for broader trend analysis.
✦Customizable Parameters: Adjust lookback periods, smoothing options, moving averages and Alerts.
✦Direction Separation: Distinguish between positive and negative amplitude movements to identify market sentiment.
✦Flexible Visualization: Customizable colors and plot styles for enhanced chart readability.
✦Alert System: Generate signals based on amplitude direction and moving average crossovers
█ How to Use and Interpret
✦Understanding Amplitude and Cumulative Amplitude:
‣Amplitude: Measures the price range (high - low) over a specified short-term period.
‣Cumulative Amplitude: Aggregates amplitude over a defined longer-term period.
‣Percentage Representation: shows amplitude relative to the open price from `amp_length` bars ago, providing a normalized view.
‣Interpretation:
Large Amplitude Values: Indicate high volatility.
Small Amplitude Values: Indicate low volatility.
✦Trend Identification:
‣Uptrend: Consistently positive amplitudes and upward-moving averages.
‣Downtrend: Consistently negative amplitudes and downward-moving averages.
✦Overbought/Oversold Conditions:
‣High Positive Amplitude: May indicate overbought conditions and potential reversals.
‣High Negative Amplitude: May indicate oversold conditions and potential reversals.
✦Volatility Analysis:
‣High Amplitude Values: Suggest increased market volatility.
‣Low Amplitude Values: Suggest reduced market volatility.
✦Signal Confirmation:
‣Moving Average Crossovers: Confirm the strength and direction of trends, aiding in informed trading decisions.
✦Trading Strategies:
‣ Breakout Trading: Large increases in amplitude can signal potential breakouts.
‣ Mean Reversion: Extreme amplitude values may indicate upcoming price corrections.
‣ Volatility-Based Strategies: Adjust position sizes or trading frequency based on amplitude magnitudes.
‣ Multi-Timeframe Analysis: Compare amplitudes across different timeframes for a comprehensive market view.
█ Customization Tips
‣ Lookback Periods: Experiment with different periods to suit your trading style and asset characteristics.
‣ Smoothing Settings: Adjust to balance responsiveness and noise reduction.
‣ Percentage Amplitude: Use for normalized comparisons across different price levels.
오픈 소스 스크립트
트레이딩뷰의 진정한 정신에 따라, 이 스크립트의 작성자는 이를 오픈소스로 공개하여 트레이더들이 기능을 검토하고 검증할 수 있도록 했습니다. 작성자에게 찬사를 보냅니다! 이 코드는 무료로 사용할 수 있지만, 코드를 재게시하는 경우 하우스 룰이 적용된다는 점을 기억하세요.
면책사항
해당 정보와 게시물은 금융, 투자, 트레이딩 또는 기타 유형의 조언이나 권장 사항으로 간주되지 않으며, 트레이딩뷰에서 제공하거나 보증하는 것이 아닙니다. 자세한 내용은 이용 약관을 참조하세요.
오픈 소스 스크립트
트레이딩뷰의 진정한 정신에 따라, 이 스크립트의 작성자는 이를 오픈소스로 공개하여 트레이더들이 기능을 검토하고 검증할 수 있도록 했습니다. 작성자에게 찬사를 보냅니다! 이 코드는 무료로 사용할 수 있지만, 코드를 재게시하는 경우 하우스 룰이 적용된다는 점을 기억하세요.
면책사항
해당 정보와 게시물은 금융, 투자, 트레이딩 또는 기타 유형의 조언이나 권장 사항으로 간주되지 않으며, 트레이딩뷰에서 제공하거나 보증하는 것이 아닙니다. 자세한 내용은 이용 약관을 참조하세요.