OPEN-SOURCE SCRIPT
업데이트됨 Bond Yeild Curve
Bond Yeild Curve
A bond yeild curve is a line that plot the interest rate of bonds of each maturity dates.
The slope of the curve give the future of economy cycle.
if the slope could be normal (positive), flat or even inverted.
This indicator aquired data of bond yeild provided by TradingView.
How to use it.
How we can get the benefit.
- If the current spread is greater than 1.0, it suppose that the economy of that country probably is ok.
- if the current spread is between 0 - 1.0, it suppose to be flatted and probably turn to invert and the economy cound be in a recession soon.
- if the current spread is below 0, it suppose to be inverted and economy is in recession.
when knowing the state of economy, it would help us to manage our investment.
When you select "Yeild"

When you select "Spread"

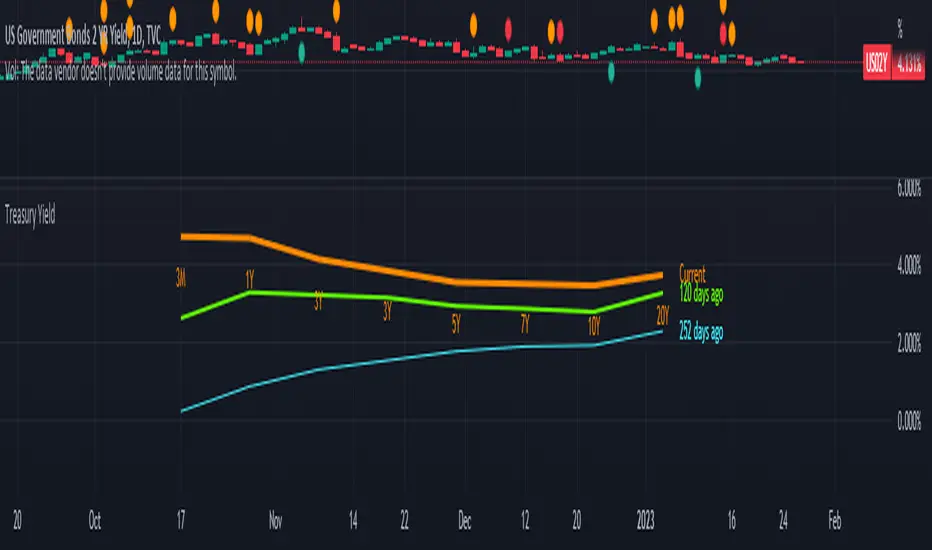
When you select "Yeild Curve"

I'm new for this.
if any idea, correction and suggestion, i do appreciate it.
A bond yeild curve is a line that plot the interest rate of bonds of each maturity dates.
The slope of the curve give the future of economy cycle.
if the slope could be normal (positive), flat or even inverted.
This indicator aquired data of bond yeild provided by TradingView.
How to use it.
- Select the country of the bond / another country to compare.
- Select the maturity of bond (this indicator set 2Y, 5Y, 10Y and 20Y as default).
- You can toggle to 3 different data set; Yeild, Spread (10Y-2Y) and Yeild Curve.
- In case that you select the "Yeild Curve", you can customize the desired past period to compare.
How we can get the benefit.
- If the current spread is greater than 1.0, it suppose that the economy of that country probably is ok.
- if the current spread is between 0 - 1.0, it suppose to be flatted and probably turn to invert and the economy cound be in a recession soon.
- if the current spread is below 0, it suppose to be inverted and economy is in recession.
when knowing the state of economy, it would help us to manage our investment.
When you select "Yeild"
When you select "Spread"
When you select "Yeild Curve"
I'm new for this.
if any idea, correction and suggestion, i do appreciate it.
릴리즈 노트
Update. 1) Compare yield curve over period of time of treasury yield.
2) Compare yield curve between countries.
3) Show yield of each ttm in line chart.
Available TTM : 3M, 1Y, 2Y, 3Y, 5Y, 7Y, 10Y, 20Y
Some code i refer to this guy.
BarefootJoey :

릴리즈 노트
Minor fixed.릴리즈 노트
Update code and added 2-10 Spread. 오픈 소스 스크립트
트레이딩뷰의 진정한 정신에 따라, 이 스크립트의 작성자는 이를 오픈소스로 공개하여 트레이더들이 기능을 검토하고 검증할 수 있도록 했습니다. 작성자에게 찬사를 보냅니다! 이 코드는 무료로 사용할 수 있지만, 코드를 재게시하는 경우 하우스 룰이 적용된다는 점을 기억하세요.
면책사항
해당 정보와 게시물은 금융, 투자, 트레이딩 또는 기타 유형의 조언이나 권장 사항으로 간주되지 않으며, 트레이딩뷰에서 제공하거나 보증하는 것이 아닙니다. 자세한 내용은 이용 약관을 참조하세요.
오픈 소스 스크립트
트레이딩뷰의 진정한 정신에 따라, 이 스크립트의 작성자는 이를 오픈소스로 공개하여 트레이더들이 기능을 검토하고 검증할 수 있도록 했습니다. 작성자에게 찬사를 보냅니다! 이 코드는 무료로 사용할 수 있지만, 코드를 재게시하는 경우 하우스 룰이 적용된다는 점을 기억하세요.
면책사항
해당 정보와 게시물은 금융, 투자, 트레이딩 또는 기타 유형의 조언이나 권장 사항으로 간주되지 않으며, 트레이딩뷰에서 제공하거나 보증하는 것이 아닙니다. 자세한 내용은 이용 약관을 참조하세요.