OPEN-SOURCE SCRIPT
업데이트됨 Major Minor Fib Points

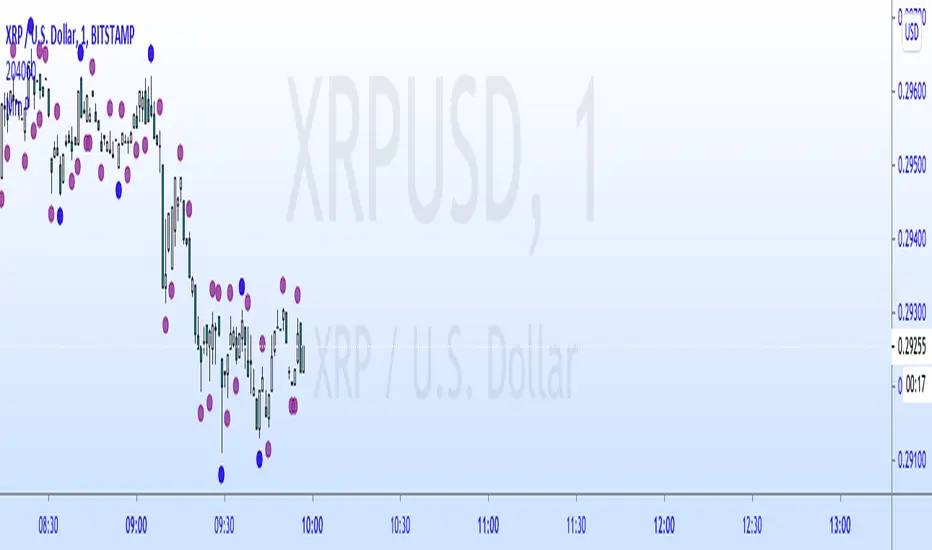
Hey guys I made this indicator that plots major and minor lows based on the candle duration since it's last seen a lower low or higher high.
I made this after watching a seminar and seeing it as a way to simply, easily and naturally find the plot points for fibonacci retracements and extentions.
Blue dots are Major, Purple are Minor.
The dots only appear if there has not been a newly established low or high in the default(13) periods (for Major) before or after that candle. This is done to make the pivot candle clear and less subjective. The periods are also changeable in the format icon.
Let me know what if you like/hate it. It's just another indicator and is only a visual tool. But I hope it helps. I hope it helps me as well!
릴리즈 노트
Update: made shapes auto size now릴리즈 노트
Added alerts on request오픈 소스 스크립트
트레이딩뷰의 진정한 정신에 따라, 이 스크립트의 작성자는 이를 오픈소스로 공개하여 트레이더들이 기능을 검토하고 검증할 수 있도록 했습니다. 작성자에게 찬사를 보냅니다! 이 코드는 무료로 사용할 수 있지만, 코드를 재게시하는 경우 하우스 룰이 적용된다는 점을 기억하세요.
면책사항
해당 정보와 게시물은 금융, 투자, 트레이딩 또는 기타 유형의 조언이나 권장 사항으로 간주되지 않으며, 트레이딩뷰에서 제공하거나 보증하는 것이 아닙니다. 자세한 내용은 이용 약관을 참조하세요.
오픈 소스 스크립트
트레이딩뷰의 진정한 정신에 따라, 이 스크립트의 작성자는 이를 오픈소스로 공개하여 트레이더들이 기능을 검토하고 검증할 수 있도록 했습니다. 작성자에게 찬사를 보냅니다! 이 코드는 무료로 사용할 수 있지만, 코드를 재게시하는 경우 하우스 룰이 적용된다는 점을 기억하세요.
면책사항
해당 정보와 게시물은 금융, 투자, 트레이딩 또는 기타 유형의 조언이나 권장 사항으로 간주되지 않으며, 트레이딩뷰에서 제공하거나 보증하는 것이 아닙니다. 자세한 내용은 이용 약관을 참조하세요.