OPEN-SOURCE SCRIPT
Volume accumulation on past range [TCS] | VTA
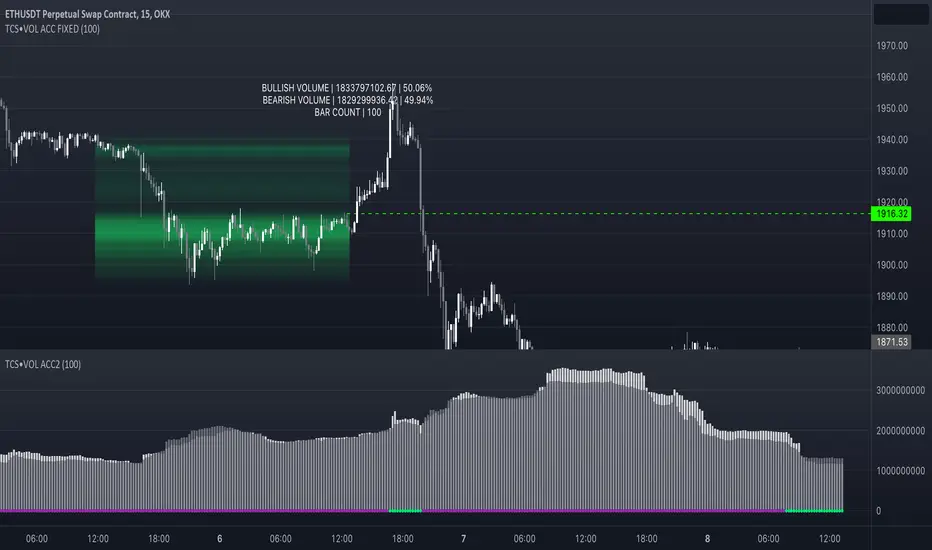
The indicator calculates buy and sell volume values for different look-back periods based on the high, low, close, and tick volume data of the chart.
The range can be selected by adding the end date and the look-back period, which starts from the end date. It can calculate a maximum of 100 candlesticks.
The calculated buy and sell volume values are stored in separate variables, representing cumulative volume values over their respective look-back periods. It's important to note that the provided code calculates the buy and sell volume values individually for each look-back period and then sums them.
This information can be useful in understanding who is in control of the market during the selected range. The 'heatmap' is particularly helpful in identifying areas of high or low trading activity, which can help define support and resistance levels.
For example, if there is a greater accumulation of bullish volume than bearish volume and a break occurs in a resistance area, it may present a good entry opportunity.

Please note that this indicator is for educational purposes only and should not be used for trading without further testing and analysis.
The range can be selected by adding the end date and the look-back period, which starts from the end date. It can calculate a maximum of 100 candlesticks.
The calculated buy and sell volume values are stored in separate variables, representing cumulative volume values over their respective look-back periods. It's important to note that the provided code calculates the buy and sell volume values individually for each look-back period and then sums them.
This information can be useful in understanding who is in control of the market during the selected range. The 'heatmap' is particularly helpful in identifying areas of high or low trading activity, which can help define support and resistance levels.
For example, if there is a greater accumulation of bullish volume than bearish volume and a break occurs in a resistance area, it may present a good entry opportunity.
Please note that this indicator is for educational purposes only and should not be used for trading without further testing and analysis.
오픈 소스 스크립트
트레이딩뷰의 진정한 정신에 따라, 이 스크립트의 작성자는 이를 오픈소스로 공개하여 트레이더들이 기능을 검토하고 검증할 수 있도록 했습니다. 작성자에게 찬사를 보냅니다! 이 코드는 무료로 사용할 수 있지만, 코드를 재게시하는 경우 하우스 룰이 적용된다는 점을 기억하세요.
For the access to premium indicators please contact me on tradingview
면책사항
해당 정보와 게시물은 금융, 투자, 트레이딩 또는 기타 유형의 조언이나 권장 사항으로 간주되지 않으며, 트레이딩뷰에서 제공하거나 보증하는 것이 아닙니다. 자세한 내용은 이용 약관을 참조하세요.