INVITE-ONLY SCRIPT
업데이트됨 [blackcat] L5 Linebreak Master
Level: 5
Background
Like many people in the Tradingview community, I have been studying how to apply Line Break Chart to backtesting and live trading for long. However, as we all know, the official Tradingview Line Break Chart is not recommended for backtesting because it will lead to unrealistic backtesting results. So, I thought about developing a Line Break Chart that can be used for backtesting and trading. This "L5 Linebreak Master" is one of them that I am introducing today.
This indicator is based on OHLC data, because this kind of chart can be used for reliable backtesting and live trading in Tradingview. Therefore, the Linebreak Master in this script can actually coexist with the standard Japanese candlestick chart, but the trend reversal information it prompts is based on a principle similar to Line Break Chart. When the two can coexist and produce trading signals at the same time, this is really a very interesting invention.
Function
Linebreak charts were developed in Japan and popularized here by Steve Nisson in his book Beyond Candlesticks. The purpose of linebreak charts is to filter out market noise and give a clear indication of the current trend and trend reversals. As you may know, sometimes determining the current trend can be difficult due to market price movement that consolidates, and a trend reversal can be just as difficult. The green and red bars are called lines. Notice that whenever we have consecutive green lines, each line has a higher close than the previous one; when we have consecutive red lines each line has a lower close than the previous line.
First of all, this Linebreak chart can coexist in the main chart with the Japanese candlestick chart. However, many parts may be overlapped with Japanese candle stick to see it clearly. My recommendation is that users can click "Settings" of main chart and turn off default candle chart.
Secondly, this Linebreak chart can be used for backtesting strategies, because it is essentially OHLC data. And the absolute values of the price is based on the original OHLC data. The certainty of the trend reversal is relatively high. It can be compared with Japanese candlesticks on the timeline.
Finally, this Linebreak chart is embedded with a Linebreak intrinsic trading strategy, which can be used to locate entry points through red and green labels. This strategy supports Tradingview alerts. You can get "LONG" or "SHORT" trading reminders by creating alerts. In order to obtain a clear market structure, Zen Stroke (Autolength ZigZag ), Zen Kiss (Special Moving Averages), Fibnacci Retracement Golden Levels, Unique Fibnacci Time windows and Dynamic Fibonicci support and resistance arrows can be checked to be superimposed and displayed on the main chart to facilitate understanding of the temporal and spatial position of prices in the market.
A trading system based on linebreak charts must must have all entries and exits based on the close or open of a line. The two key values of a linebreak chart are the linebreak number and the underlying time interval. We can construct linebreak charts based on daily, weekly, 5 minute, hourly, any time frame. This allows us to adapt it for day trading or swing trading systems. I developped an inheret linebreak strategy with labels facilitate you to locate trend reversals.
Indicator Set
Linebreak Master Chart (新价图)
Zen Stroke (Auto ZigZag , 自动画缠论笔)
Zen Kiss Moving Averages (缠论均线)
Fibnacci Retracement Golden Levels (半对数-黄金分割线)
Unique Fibnacci Time windows (独创的斐波那契时间窗口)
Dynamic Fibonicci support and resistance arrows (动态斐波那契支撑和阻力箭头)
Inputs
Source Type: Open, High, Low, Close, Hl2, Hlc3, Lx, Vwapc, Vwaplx, Vwaphl2 (Case Sensitive)
Returns source input selection variant, default to "Close" if blank or typo.
Open --> open
High --> High
Low --> Low
Close --> Close
Hl2 --> hl2
Hlc3 --> hlc3
Lx --> Lao Xu 1949 Median Price
Vwapc --> vwap based on close
Vwaplx --> vwap based on Lao Xu 1949 Median Price
Vwaphl2 --> vwap based on hl2
Show Zen Stroke --> True as default
Show Fib Space based on Semi-LOG --> True as default
Zen Fractals Lookback Period --> 377 as default
Key Signal
Bars
Green bars for up trend
Red bars for down trend
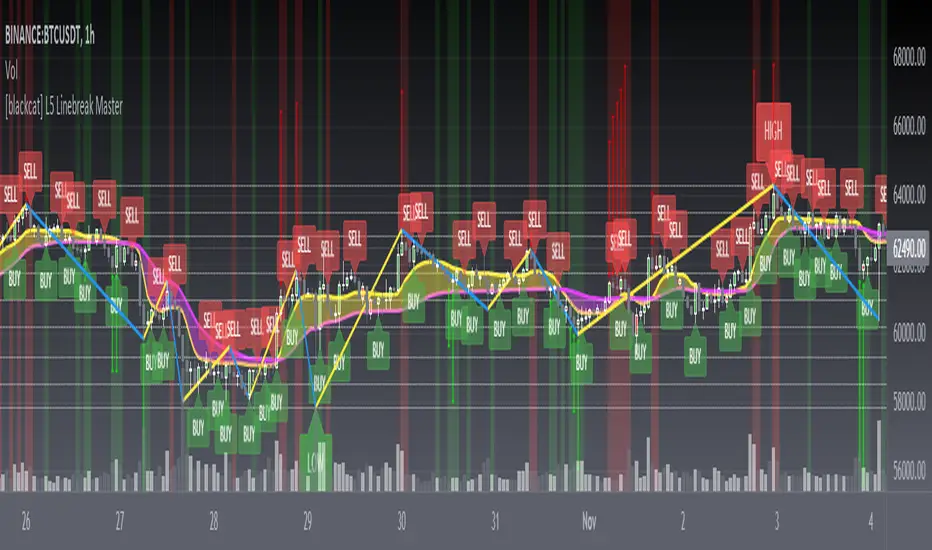
Labels
Green labels for buy/long.
Red labels for sell/short.
Zen Stroke ( ZigZag )
Green line section for up stroke
Red line section for down stroke
Moving Averages
Yellow for fast line
Fuchsia for slow line
Pros and Cons
Suitable for discretionary trading and bots via alerts. However, only well selected trading pair and time frame can guarantee bot works.
Intuitive and effective, the output signal is more reliable after multi-indicator resonance
Remarks
My fourth L5 indicator published
Closed-source
Invite-only
How to get it?
500 Tradingview Coins Per Monthly Subscription
5000 Tradingview Coins Per Yearly Subscription
Background
Like many people in the Tradingview community, I have been studying how to apply Line Break Chart to backtesting and live trading for long. However, as we all know, the official Tradingview Line Break Chart is not recommended for backtesting because it will lead to unrealistic backtesting results. So, I thought about developing a Line Break Chart that can be used for backtesting and trading. This "L5 Linebreak Master" is one of them that I am introducing today.
This indicator is based on OHLC data, because this kind of chart can be used for reliable backtesting and live trading in Tradingview. Therefore, the Linebreak Master in this script can actually coexist with the standard Japanese candlestick chart, but the trend reversal information it prompts is based on a principle similar to Line Break Chart. When the two can coexist and produce trading signals at the same time, this is really a very interesting invention.
Function
Linebreak charts were developed in Japan and popularized here by Steve Nisson in his book Beyond Candlesticks. The purpose of linebreak charts is to filter out market noise and give a clear indication of the current trend and trend reversals. As you may know, sometimes determining the current trend can be difficult due to market price movement that consolidates, and a trend reversal can be just as difficult. The green and red bars are called lines. Notice that whenever we have consecutive green lines, each line has a higher close than the previous one; when we have consecutive red lines each line has a lower close than the previous line.
First of all, this Linebreak chart can coexist in the main chart with the Japanese candlestick chart. However, many parts may be overlapped with Japanese candle stick to see it clearly. My recommendation is that users can click "Settings" of main chart and turn off default candle chart.
Secondly, this Linebreak chart can be used for backtesting strategies, because it is essentially OHLC data. And the absolute values of the price is based on the original OHLC data. The certainty of the trend reversal is relatively high. It can be compared with Japanese candlesticks on the timeline.
Finally, this Linebreak chart is embedded with a Linebreak intrinsic trading strategy, which can be used to locate entry points through red and green labels. This strategy supports Tradingview alerts. You can get "LONG" or "SHORT" trading reminders by creating alerts. In order to obtain a clear market structure, Zen Stroke (Autolength ZigZag ), Zen Kiss (Special Moving Averages), Fibnacci Retracement Golden Levels, Unique Fibnacci Time windows and Dynamic Fibonicci support and resistance arrows can be checked to be superimposed and displayed on the main chart to facilitate understanding of the temporal and spatial position of prices in the market.
A trading system based on linebreak charts must must have all entries and exits based on the close or open of a line. The two key values of a linebreak chart are the linebreak number and the underlying time interval. We can construct linebreak charts based on daily, weekly, 5 minute, hourly, any time frame. This allows us to adapt it for day trading or swing trading systems. I developped an inheret linebreak strategy with labels facilitate you to locate trend reversals.
Indicator Set
Linebreak Master Chart (新价图)
Zen Stroke (Auto ZigZag , 自动画缠论笔)
Zen Kiss Moving Averages (缠论均线)
Fibnacci Retracement Golden Levels (半对数-黄金分割线)
Unique Fibnacci Time windows (独创的斐波那契时间窗口)
Dynamic Fibonicci support and resistance arrows (动态斐波那契支撑和阻力箭头)
Inputs
Source Type: Open, High, Low, Close, Hl2, Hlc3, Lx, Vwapc, Vwaplx, Vwaphl2 (Case Sensitive)
Returns source input selection variant, default to "Close" if blank or typo.
Open --> open
High --> High
Low --> Low
Close --> Close
Hl2 --> hl2
Hlc3 --> hlc3
Lx --> Lao Xu 1949 Median Price
Vwapc --> vwap based on close
Vwaplx --> vwap based on Lao Xu 1949 Median Price
Vwaphl2 --> vwap based on hl2
Show Zen Stroke --> True as default
Show Fib Space based on Semi-LOG --> True as default
Zen Fractals Lookback Period --> 377 as default
Key Signal
Bars
Green bars for up trend
Red bars for down trend
Labels
Green labels for buy/long.
Red labels for sell/short.
Zen Stroke ( ZigZag )
Green line section for up stroke
Red line section for down stroke
Moving Averages
Yellow for fast line
Fuchsia for slow line
Pros and Cons
Suitable for discretionary trading and bots via alerts. However, only well selected trading pair and time frame can guarantee bot works.
Intuitive and effective, the output signal is more reliable after multi-indicator resonance
Remarks
My fourth L5 indicator published
Closed-source
Invite-only
How to get it?
500 Tradingview Coins Per Monthly Subscription
5000 Tradingview Coins Per Yearly Subscription
릴리즈 노트
As requested, I add plot signal for zendog backtest as://///////////// Plotting ///////////////
plot(buy ? 1:0, title="buy", title="Buy", display=display.none) //plot for buy icon
plot(sell ? 1:0, title="sell", title="Sell", display=display.none)

초대 전용 스크립트
이 스크립트는 작성자가 승인한 사용자만 접근할 수 있습니다. 사용하려면 요청 후 승인을 받아야 하며, 일반적으로 결제 후에 허가가 부여됩니다. 자세한 내용은 아래 작성자의 안내를 따르거나 blackcat1402에게 직접 문의하세요.
트레이딩뷰는 스크립트의 작동 방식을 충분히 이해하고 작성자를 완전히 신뢰하지 않는 이상, 해당 스크립트에 비용을 지불하거나 사용하는 것을 권장하지 않습니다. 커뮤니티 스크립트에서 무료 오픈소스 대안을 찾아보실 수도 있습니다.
작성자 지시 사항
Monthly subscription and annual subscription can be done either by tradingview coins (TVC) or by converting into equivalent cryptocurrency at the exchange rate (1TVC=0.01USD) for redeem. To pay TVC directly in the comments below. Or DM me for crypto pay.
Avoid losing contact!Don't miss out! The first and most important thing to do is to join my Discord chat now! Click here to start your adventure: discord.com/invite/ZTGpQJq 防止失联,请立即行动,加入本猫聊天群: discord.com/invite/ZTGpQJq
면책사항
해당 정보와 게시물은 금융, 투자, 트레이딩 또는 기타 유형의 조언이나 권장 사항으로 간주되지 않으며, 트레이딩뷰에서 제공하거나 보증하는 것이 아닙니다. 자세한 내용은 이용 약관을 참조하세요.