PROTECTED SOURCE SCRIPT
업데이트됨 BiasByCryptx
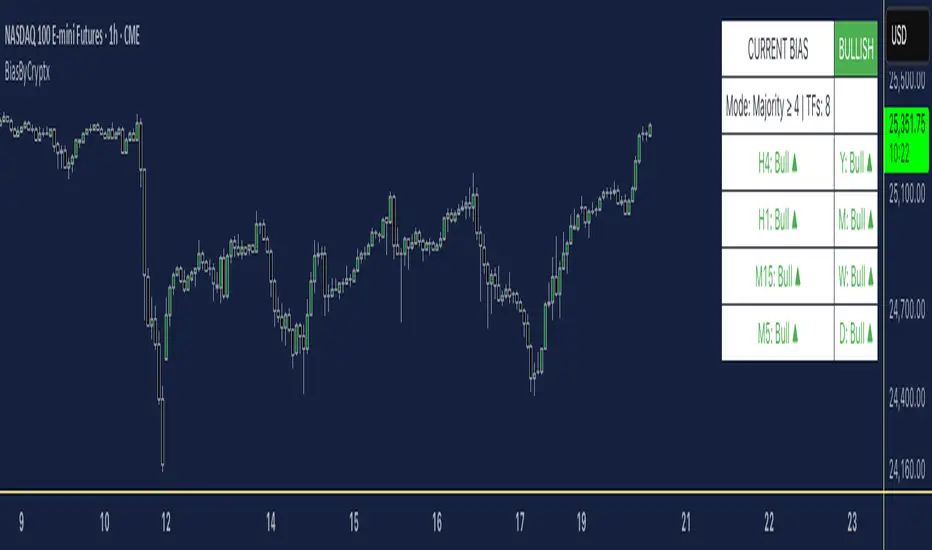
This is a lightweight market-bias dashboard. For each selected timeframe, Prior Year, Month, Week, Day, H4, H1. It uses the previous completed period’s high and low to compute the 50% midpoint, then labels Bullish when the current bar is above it, otherwise, Bearish.
You can choose which timeframes contribute and how agreement is determined: Strict (all selected must agree) or Majority (≥ N). The dashboard shows the overall bias and per-timeframe status with green ▲ (Bull) and red ▼ (Bear). It relies only on completed prior periods (no look-ahead) for stable signals and suits both intraday (e.g., D + H4) and swing (e.g., W + D + H4) workflows.
**Disclaimer:** This tool is for educational purposes only and is not financial advice. Always validate signals with your own analysis and backtests. Market conditions, data feeds, time zones, slippage, fees, and liquidity can affect outcomes. Past performance does not guarantee future results.
릴리즈 노트
- New timeframes: H15 and H5 (toggle alongside Y, M, W, D, H4, H1).- Majority (≥ N) now supports up to N = 8 (auto-clamped to selected TFs).
- Status colors: green ▲ = Bull, red ▼ = Bear, gray = Off.
- Dashboard layout: Column 1 → H4, H1, H15, H5 | Column 2 → Y, M, W, D.
- Logic unchanged: uses prior period’s 50% midpoint; close > midpoint = Bull, else Bear.
릴리즈 노트
Bug fixed for H15, H5 to M15, M5보호된 스크립트입니다
이 스크립트는 비공개 소스로 게시됩니다. 하지만 제한 없이 자유롭게 사용할 수 있습니다 — 여기에서 자세히 알아보기.
면책사항
이 정보와 게시물은 TradingView에서 제공하거나 보증하는 금융, 투자, 거래 또는 기타 유형의 조언이나 권고 사항을 의미하거나 구성하지 않습니다. 자세한 내용은 이용 약관을 참고하세요.
면책사항
이 정보와 게시물은 TradingView에서 제공하거나 보증하는 금융, 투자, 거래 또는 기타 유형의 조언이나 권고 사항을 의미하거나 구성하지 않습니다. 자세한 내용은 이용 약관을 참고하세요.