OPEN-SOURCE SCRIPT
Volume Weighted Average Price Z-Score [tordne]
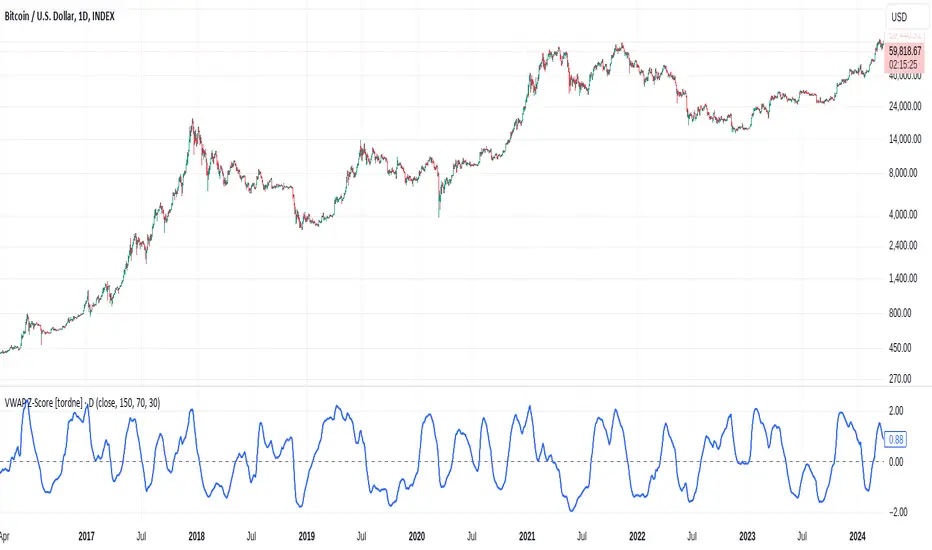
The VWAP Z-Score indicator calculates the Z-score of the Volume Weighted Average Price (VWAP) Ratio, allowing traders to analyze how the current price compares to the VWAP over a specified period. This can provide insights into the relative price strength, overbought/oversold conditions, and price deviations from its average.
Key Components:
VWAP Calculation:
VWAP (Volume Weighted Average Price) is the ratio of the cumulative traded value (price multiplied by volume) to the cumulative volume over a specified period (VWAP Calculation Length).
The VWAP Ratio is then computed by dividing the current price (or selected source) by the calculated VWAP.
Z-Score Calculation:
The Z-score is a statistical measure that shows how far the current VWAP Ratio deviates from its mean, in terms of standard deviations.
The Z-score is calculated by comparing the VWAP Ratio to its moving average (Z-Score Length) and dividing the difference by the standard deviation of the VWAP Ratio over the same period.
This helps in identifying whether the current price is unusually high or low relative to its VWAP.
Smoothing:
The Z-score is further smoothed using an Exponential Moving Average (EMA) to reduce noise and enhance readability. The smoothing length is adjustable via the input settings (Smoothing Length), with a default value of 14 periods.
Input Parameters:
Source: The price source used for calculation (default is the closing price).
VWAP Calculation Length: Defines the period over which the VWAP is calculated (default is 150).
Z-Score Length: The lookback period for calculating the Z-score (default is 70).
Smoothing Length (EMA): The number of periods over which to smooth the Z-score using an EMA (default is 30).
Interpretation:
Z-Score:
A Z-score close to 0 indicates that the price is close to its VWAP.
A positive Z-score suggests that the price is higher than its VWAP, potentially indicating overbought conditions.
A negative Z-score suggests that the price is lower than its VWAP, potentially indicating oversold conditions.
This indicator provides a dynamic and statistical way of assessing price movements relative to VWAP, aiding in mean reversion strategies, trend following, or momentum analysis.
오픈 소스 스크립트
트레이딩뷰의 진정한 정신에 따라, 이 스크립트의 작성자는 이를 오픈소스로 공개하여 트레이더들이 기능을 검토하고 검증할 수 있도록 했습니다. 작성자에게 찬사를 보냅니다! 이 코드는 무료로 사용할 수 있지만, 코드를 재게시하는 경우 하우스 룰이 적용된다는 점을 기억하세요.
면책사항
해당 정보와 게시물은 금융, 투자, 트레이딩 또는 기타 유형의 조언이나 권장 사항으로 간주되지 않으며, 트레이딩뷰에서 제공하거나 보증하는 것이 아닙니다. 자세한 내용은 이용 약관을 참조하세요.
오픈 소스 스크립트
트레이딩뷰의 진정한 정신에 따라, 이 스크립트의 작성자는 이를 오픈소스로 공개하여 트레이더들이 기능을 검토하고 검증할 수 있도록 했습니다. 작성자에게 찬사를 보냅니다! 이 코드는 무료로 사용할 수 있지만, 코드를 재게시하는 경우 하우스 룰이 적용된다는 점을 기억하세요.
면책사항
해당 정보와 게시물은 금융, 투자, 트레이딩 또는 기타 유형의 조언이나 권장 사항으로 간주되지 않으며, 트레이딩뷰에서 제공하거나 보증하는 것이 아닙니다. 자세한 내용은 이용 약관을 참조하세요.