OPEN-SOURCE SCRIPT
업데이트됨 Future SD Projection
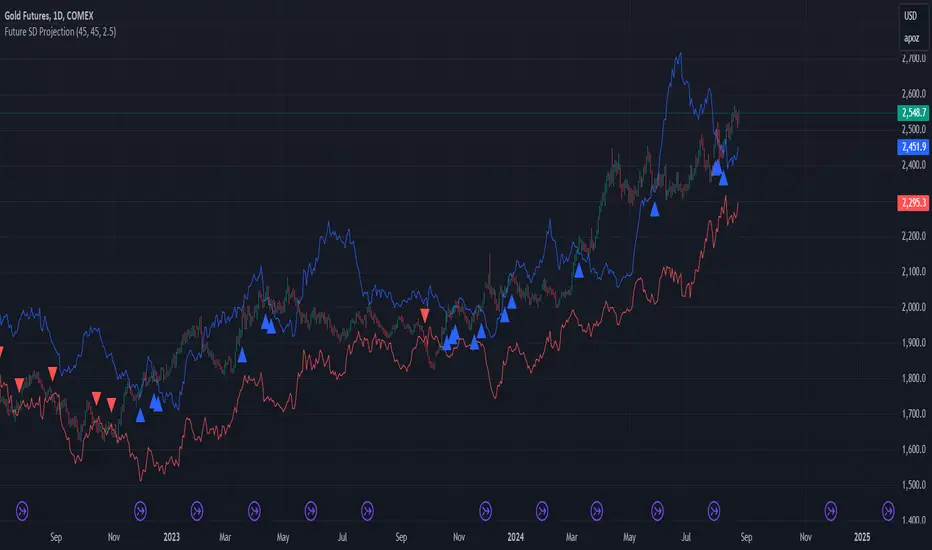
Future Standard Deviation Projector
This innovative indicator projects price volatility into the future, helping traders anticipate potential price ranges and breakouts. It calculates standard deviation bands based on recent price action and extends them forward, providing a unique perspective on future price movement possibilities.
Key Features:
- Projects standard deviation bands into the future
- Customizable lookback period for volatility calculation
- Adjustable future projection timeframe
- Flexible standard deviation multiplier
- Clear visual signals for band breaches
How it works:
1. Calculates standard deviation from recent closing prices
2. Projects upper and lower bands into the future
3. Plots these bands on the chart
4. Signals with arrows when closing price crosses projected bands
Use this indicator to:
- Gauge potential future price ranges
- Identify possible breakout levels
- Assess market volatility expectations
- Enhance your trading strategy with forward-looking volatility projections
Customize the settings to align with your trading timeframe and risk tolerance. Remember, while this tool offers valuable insights, it should be used in conjunction with other analysis methods for comprehensive trading decisions.
Note: Past performance and projections do not guarantee future results. Always manage your risk appropriately.
릴리즈 노트
Future Standard Deviation ProjectorThis innovative indicator projects price volatility into the future, helping traders anticipate potential price ranges and breakouts. It calculates standard deviation bands based on recent price action and extends them forward, providing a unique perspective on future price movement possibilities.
Key Features:
- Projects standard deviation bands into the future
- Customizable lookback period for volatility calculation
- Adjustable future projection timeframe
- Flexible standard deviation multiplier
- Clear visual signals for band breaches
How it works:
1. Calculates standard deviation from recent closing prices
2. Projects upper and lower bands into the future
3. Plots these bands on the chart
4. Signals with arrows when closing price crosses projected bands
Use this indicator to:
- Gauge potential future price ranges
- Identify possible breakout levels
- Assess market volatility expectations
- Enhance your trading strategy with forward-looking volatility projections
Customize the settings to align with your trading timeframe and risk tolerance. Remember, while this tool offers valuable insights, it should be used in conjunction with other analysis methods for comprehensive trading decisions.
Note: Past performance and projections do not guarantee future results. Always manage your risk appropriately.
오픈 소스 스크립트
트레이딩뷰의 진정한 정신에 따라, 이 스크립트의 작성자는 이를 오픈소스로 공개하여 트레이더들이 기능을 검토하고 검증할 수 있도록 했습니다. 작성자에게 찬사를 보냅니다! 이 코드는 무료로 사용할 수 있지만, 코드를 재게시하는 경우 하우스 룰이 적용된다는 점을 기억하세요.
면책사항
해당 정보와 게시물은 금융, 투자, 트레이딩 또는 기타 유형의 조언이나 권장 사항으로 간주되지 않으며, 트레이딩뷰에서 제공하거나 보증하는 것이 아닙니다. 자세한 내용은 이용 약관을 참조하세요.
오픈 소스 스크립트
트레이딩뷰의 진정한 정신에 따라, 이 스크립트의 작성자는 이를 오픈소스로 공개하여 트레이더들이 기능을 검토하고 검증할 수 있도록 했습니다. 작성자에게 찬사를 보냅니다! 이 코드는 무료로 사용할 수 있지만, 코드를 재게시하는 경우 하우스 룰이 적용된다는 점을 기억하세요.
면책사항
해당 정보와 게시물은 금융, 투자, 트레이딩 또는 기타 유형의 조언이나 권장 사항으로 간주되지 않으며, 트레이딩뷰에서 제공하거나 보증하는 것이 아닙니다. 자세한 내용은 이용 약관을 참조하세요.