OPEN-SOURCE SCRIPT
업데이트됨 sᴛᴀɢᴇ ᴀɴᴀʏʟsɪs

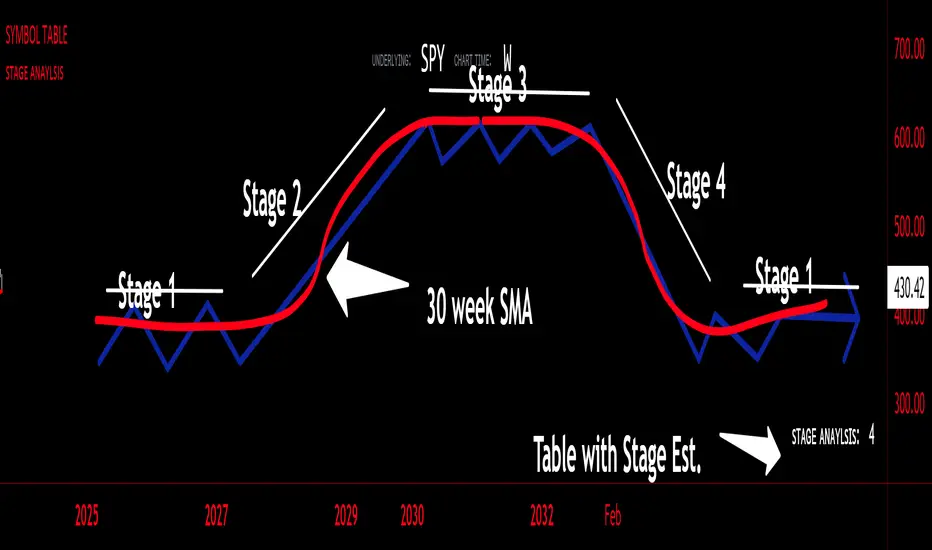
Stage analysis is a technical analysis approach that involves categorizing a stock's price movements into different stages to help traders and investors make more informed decisions. It was popularized by Stan Weinstein in his book, "Secrets for Profiting in Bull and Bear Markets." The stages are used to identify the overall trend and to time entries and exits in the market. Here's an explanation of the typical stages in stage analysis:
1. **Stage 1: Accumulation Phase**
- In this stage, the stock is in a downtrend or has been trading sideways for an extended period.
- Volume is relatively low, indicating that institutions and smart money may be quietly accumulating shares.
- The stock may test and hold support levels, showing signs of stability.
- The goal for traders in this stage is to identify the potential for a trend reversal.
2. **Stage 2: Markup (Bull Market) Phase**
- This is the stage where the stock starts a significant uptrend.
- Volume increases as institutional and retail investors become more interested in the stock.
- Technical indicators like moving averages and trendlines confirm the uptrend.
- Traders and investors look for buying opportunities during pullbacks or consolidations within the uptrend.
3. **Stage 3: Distribution Phase**
- In this stage, the stock's price begins to show signs of weakness.
- Volume might decrease as institutions and smart money start selling their positions.
- The stock may start forming a trading range or exhibit bearish chart patterns.
- Traders should consider taking profits or reducing exposure to the stock as it may enter a downtrend.
4. **Stage 4: Markdown (Bear Market) Phase**
- This is the stage where the stock enters a significant downtrend.
- Volume may remain elevated as selling pressure dominates.
- Technical indicators confirm the downtrend.
- Traders and investors should avoid buying the stock and may consider short-selling or staying on the sidelines.
Stage analysis helps traders and investors make decisions based on the current stage of a stock's price movement. The goal is to enter during the accumulation phase or early in the markup phase and exit during the distribution phase or before the markdown phase to maximize profits and minimize losses.
=============================================================
try to just show the Stage number in a table, but always double check for yourself
릴리즈 노트
Just a small touch up오픈 소스 스크립트
트레이딩뷰의 진정한 정신에 따라, 이 스크립트의 작성자는 이를 오픈소스로 공개하여 트레이더들이 기능을 검토하고 검증할 수 있도록 했습니다. 작성자에게 찬사를 보냅니다! 이 코드는 무료로 사용할 수 있지만, 코드를 재게시하는 경우 하우스 룰이 적용된다는 점을 기억하세요.
면책사항
해당 정보와 게시물은 금융, 투자, 트레이딩 또는 기타 유형의 조언이나 권장 사항으로 간주되지 않으며, 트레이딩뷰에서 제공하거나 보증하는 것이 아닙니다. 자세한 내용은 이용 약관을 참조하세요.
오픈 소스 스크립트
트레이딩뷰의 진정한 정신에 따라, 이 스크립트의 작성자는 이를 오픈소스로 공개하여 트레이더들이 기능을 검토하고 검증할 수 있도록 했습니다. 작성자에게 찬사를 보냅니다! 이 코드는 무료로 사용할 수 있지만, 코드를 재게시하는 경우 하우스 룰이 적용된다는 점을 기억하세요.
면책사항
해당 정보와 게시물은 금융, 투자, 트레이딩 또는 기타 유형의 조언이나 권장 사항으로 간주되지 않으며, 트레이딩뷰에서 제공하거나 보증하는 것이 아닙니다. 자세한 내용은 이용 약관을 참조하세요.