OPEN-SOURCE SCRIPT
업데이트됨 Tracking Lines with TP/SL + Labels at Left
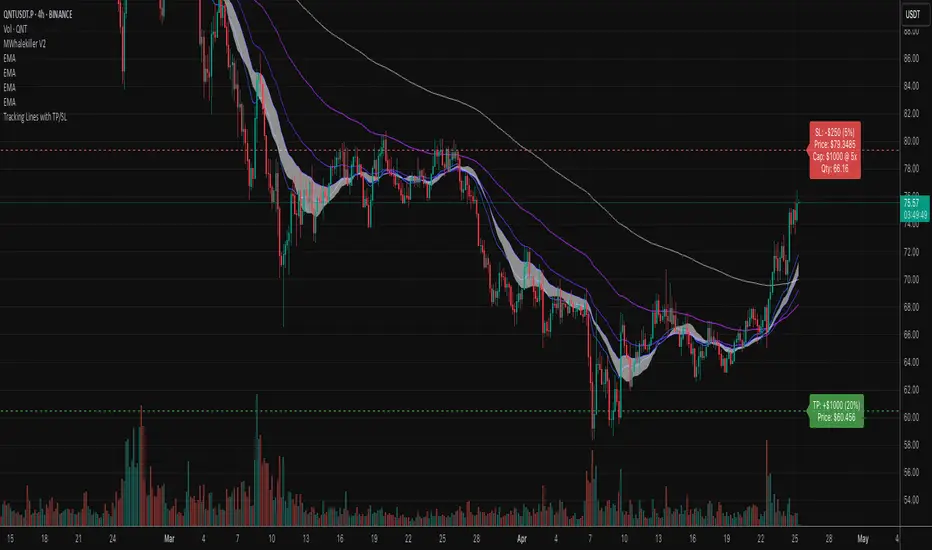
A simple indicator so you can set your TP and SL tolerance along with capital and leverage.
A red line and green line will represent where current TP and SL would be on the chart along with the number of tokens you need to trade to meet the USD capital to be trades.
Just gives a visual representation of SL to key zones on the chart so you can judge scalp entries a little better :)
A red line and green line will represent where current TP and SL would be on the chart along with the number of tokens you need to trade to meet the USD capital to be trades.
Just gives a visual representation of SL to key zones on the chart so you can judge scalp entries a little better :)
릴리즈 노트
This indicator plots dynamic Take Profit (TP) and Stop Loss (SL) levels based on customizable percentages above and below the current price. It calculates and displays:Your total trade value based on capital and leverage
The dollar amount you stand to gain (TP) or lose (SL)
The number of tokens/contracts needed at current price
Fully customisable label colours and opacity for clean visuals
Ideal for quickly visualising profit/loss zones and managing risk with precision.
릴리즈 노트
This indicator plots dynamic Take Profit (TP) and Stop Loss (SL) levels based on customizable percentages above and below the current price. It calculates and displays:Your total trade value based on capital and leverage
The dollar amount you stand to gain (TP) or lose (SL)
The number of tokens/contracts needed at current price
Fully customizable label colors and opacity for clean visuals
Ideal for quickly visualizing profit/loss zones and managing risk with precision.
오픈 소스 스크립트
트레이딩뷰의 진정한 정신에 따라, 이 스크립트의 작성자는 이를 오픈소스로 공개하여 트레이더들이 기능을 검토하고 검증할 수 있도록 했습니다. 작성자에게 찬사를 보냅니다! 이 코드는 무료로 사용할 수 있지만, 코드를 재게시하는 경우 하우스 룰이 적용된다는 점을 기억하세요.
면책사항
해당 정보와 게시물은 금융, 투자, 트레이딩 또는 기타 유형의 조언이나 권장 사항으로 간주되지 않으며, 트레이딩뷰에서 제공하거나 보증하는 것이 아닙니다. 자세한 내용은 이용 약관을 참조하세요.
오픈 소스 스크립트
트레이딩뷰의 진정한 정신에 따라, 이 스크립트의 작성자는 이를 오픈소스로 공개하여 트레이더들이 기능을 검토하고 검증할 수 있도록 했습니다. 작성자에게 찬사를 보냅니다! 이 코드는 무료로 사용할 수 있지만, 코드를 재게시하는 경우 하우스 룰이 적용된다는 점을 기억하세요.
면책사항
해당 정보와 게시물은 금융, 투자, 트레이딩 또는 기타 유형의 조언이나 권장 사항으로 간주되지 않으며, 트레이딩뷰에서 제공하거나 보증하는 것이 아닙니다. 자세한 내용은 이용 약관을 참조하세요.