OPEN-SOURCE SCRIPT
Candle Price Movement
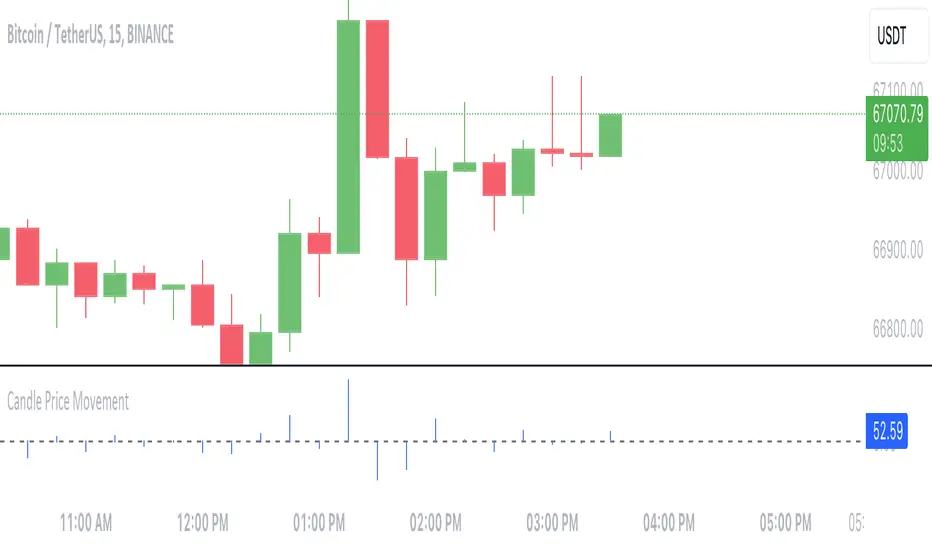
This Pine Script indicator calculates and visualizes the price movement for each candlestick on the chart.
- **Calculation**: The price movement for each candle is determined by subtracting the opening price from the closing price.
- **Visualization**: The price movement is plotted as a histogram, with positive values indicating upward movement (green bars) and negative values indicating downward movement (red bars).
- **Options**:
- The histogram bars are colored blue with zero opacity, providing a clear visual distinction from the background.
- A horizontal line at zero (the "Zero Line") is added for reference, helping to identify periods of no price movement.
---
This indicator provides traders with a quick visualization of the price movement for each candlestick, helping to identify trends and potential trading opportunities.
오픈 소스 스크립트
트레이딩뷰의 진정한 정신에 따라, 이 스크립트의 작성자는 이를 오픈소스로 공개하여 트레이더들이 기능을 검토하고 검증할 수 있도록 했습니다. 작성자에게 찬사를 보냅니다! 이 코드는 무료로 사용할 수 있지만, 코드를 재게시하는 경우 하우스 룰이 적용된다는 점을 기억하세요.
면책사항
해당 정보와 게시물은 금융, 투자, 트레이딩 또는 기타 유형의 조언이나 권장 사항으로 간주되지 않으며, 트레이딩뷰에서 제공하거나 보증하는 것이 아닙니다. 자세한 내용은 이용 약관을 참조하세요.
오픈 소스 스크립트
트레이딩뷰의 진정한 정신에 따라, 이 스크립트의 작성자는 이를 오픈소스로 공개하여 트레이더들이 기능을 검토하고 검증할 수 있도록 했습니다. 작성자에게 찬사를 보냅니다! 이 코드는 무료로 사용할 수 있지만, 코드를 재게시하는 경우 하우스 룰이 적용된다는 점을 기억하세요.
면책사항
해당 정보와 게시물은 금융, 투자, 트레이딩 또는 기타 유형의 조언이나 권장 사항으로 간주되지 않으며, 트레이딩뷰에서 제공하거나 보증하는 것이 아닙니다. 자세한 내용은 이용 약관을 참조하세요.