OPEN-SOURCE SCRIPT
Chebyshev Filter Divergences [ChartPrime]
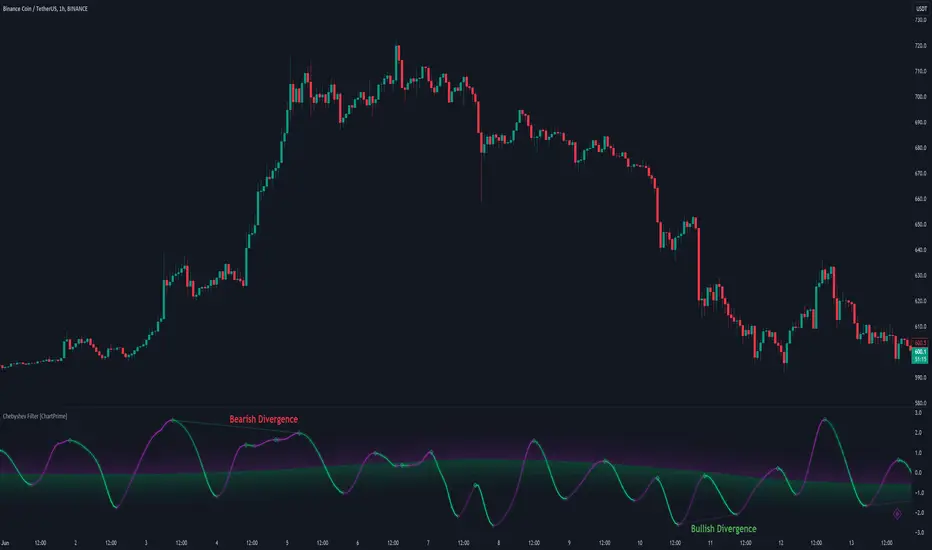
The Chebyshev Filter Divergences Oscillator
The Chebyshev Filter indicator is a powerful tool designed to identify potential divergences between price and a filtered version of price based on the Chebyshev filter algorithm. It helps to spot mean reversion points by highlighting areas where price and the filtered price exhibit conflicting signals.
Chebyshev Filter Background:
The Chebyshev filter, named after the Russian mathematician Pafnuty Chebyshev, was invented in the mid-19th century. It's a type of filter used in signal processing and digital signal processing for smoothing or removing unwanted frequency components from a signal.
It provides a sharp cutoff between the passband and stopband of a filter while minimizing ripple in the passband or stopband.
Chebyshev filters are widely used in various applications, including audio and image processing, telecommunications, and financial analysis, due to their efficiency and effectiveness in filtering out noise and extracting relevant information from signals.
◆ Indicator Calculation:
The indicator first applies a Chebyshev filter to the price data, producing a filtered price series. It then normalizes this filtered price series to a range, where it can be used as oscillator with divergences.
◆ Visualization:
The filtered price series is plotted on the chart, highlighting areas where it deviates from its smoothed average.

Bullish and bearish divergences are marked on the chart with specific lines and colors, indicating potential shifts in market sentiment.

Signs of change in direction are also marked on the chart, providing additional insights into possible mean reversals of price.

◆ User Inputs:
In conclusion, the Chebyshev Filter Divergences indicator, with its ability to identify potential mean reversion points through divergences between price and a filtered version of price, offers traders a valuable tool for decision-making in the financial markets. By highlighting areas of divergence, traders can potentially capitalize on market inefficiencies and make more informed trading decisions.
The Chebyshev Filter indicator is a powerful tool designed to identify potential divergences between price and a filtered version of price based on the Chebyshev filter algorithm. It helps to spot mean reversion points by highlighting areas where price and the filtered price exhibit conflicting signals.
Chebyshev Filter Background:
The Chebyshev filter, named after the Russian mathematician Pafnuty Chebyshev, was invented in the mid-19th century. It's a type of filter used in signal processing and digital signal processing for smoothing or removing unwanted frequency components from a signal.
It provides a sharp cutoff between the passband and stopband of a filter while minimizing ripple in the passband or stopband.
Chebyshev filters are widely used in various applications, including audio and image processing, telecommunications, and financial analysis, due to their efficiency and effectiveness in filtering out noise and extracting relevant information from signals.
◆ Indicator Calculation:
The indicator first applies a Chebyshev filter to the price data, producing a filtered price series. It then normalizes this filtered price series to a range, where it can be used as oscillator with divergences.
◆ Visualization:
The filtered price series is plotted on the chart, highlighting areas where it deviates from its smoothed average.
Bullish and bearish divergences are marked on the chart with specific lines and colors, indicating potential shifts in market sentiment.
Signs of change in direction are also marked on the chart, providing additional insights into possible mean reversals of price.
◆ User Inputs:
- Ripple (dB): Specifies the desired ripple factor in decibels for the Chebyshev filter.
- Normalization Length: Sets the length of the normalization period used in the Chebyshev filter.
- Pivots to Right and Left: Determines the number of pivot points to the right and left of the current point to consider when detecting divergences.
- Max and Min of Lookback Range: Specifies the maximum and minimum lookback range for identifying divergences.
- Show Divergences: Enables or disables the display of bullish and bearish divergences.
- Visual Settings: Allows customization of colors for visual clarity.
In conclusion, the Chebyshev Filter Divergences indicator, with its ability to identify potential mean reversion points through divergences between price and a filtered version of price, offers traders a valuable tool for decision-making in the financial markets. By highlighting areas of divergence, traders can potentially capitalize on market inefficiencies and make more informed trading decisions.
오픈 소스 스크립트
트레이딩뷰의 진정한 정신에 따라, 이 스크립트의 작성자는 이를 오픈소스로 공개하여 트레이더들이 기능을 검토하고 검증할 수 있도록 했습니다. 작성자에게 찬사를 보냅니다! 이 코드는 무료로 사용할 수 있지만, 코드를 재게시하는 경우 하우스 룰이 적용된다는 점을 기억하세요.
면책사항
해당 정보와 게시물은 금융, 투자, 트레이딩 또는 기타 유형의 조언이나 권장 사항으로 간주되지 않으며, 트레이딩뷰에서 제공하거나 보증하는 것이 아닙니다. 자세한 내용은 이용 약관을 참조하세요.
오픈 소스 스크립트
트레이딩뷰의 진정한 정신에 따라, 이 스크립트의 작성자는 이를 오픈소스로 공개하여 트레이더들이 기능을 검토하고 검증할 수 있도록 했습니다. 작성자에게 찬사를 보냅니다! 이 코드는 무료로 사용할 수 있지만, 코드를 재게시하는 경우 하우스 룰이 적용된다는 점을 기억하세요.
면책사항
해당 정보와 게시물은 금융, 투자, 트레이딩 또는 기타 유형의 조언이나 권장 사항으로 간주되지 않으며, 트레이딩뷰에서 제공하거나 보증하는 것이 아닙니다. 자세한 내용은 이용 약관을 참조하세요.