OPEN-SOURCE SCRIPT
Smart Ribbon V2 [FXSMARTLAB]
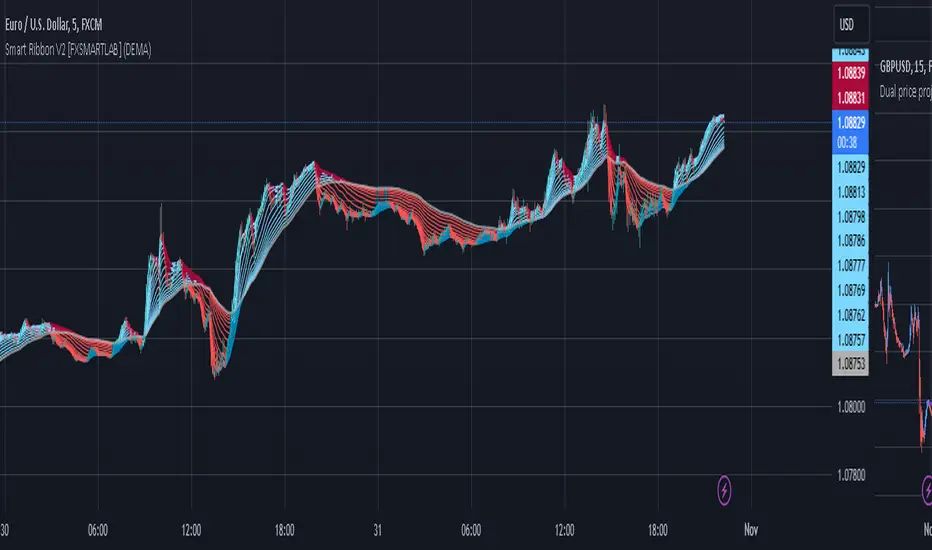
The Smart Ribbon V2 indicator is designed to analyze market trends and momentum by plotting a series of moving averages with varying periods, all within a single overlay on the price chart. This approach creates a "ribbon" effect, enabling traders to visualize trend strength, reversals, and potential entry or exit points. The indicator provides flexibility through different moving average types, including some advanced ones like QUEMA (Quadruple Exponential Moving Average) and QuintEMA (Quintuple Exponential Moving Average). Each moving average is color-coded to indicate trend direction and momentum, making it visually intuitive and effective for quick decision-making in trend-following strategies.
The Smart Ribbon V2 helps traders:
Detailed Explanation of QUEMA and QuintEMA
The QUEMA (Quadruple Exponential Moving Average) and QuintEMA (Quintuple Exponential Moving Average) are advanced smoothing techniques that build on traditional exponential moving averages (EMAs). Both offer higher sensitivity to recent price changes than standard EMAs by adding layers of exponential smoothing. These moving averages are particularly useful for traders looking for a more responsive indicator without the noise often present in shorter-period EMAs.
QUEMA (Quadruple Exponential Moving Average)
The QUEMA is calculated by applying the EMA calculation four times in succession. This method smooths out fluctuations in the price data, creating a balance between sensitivity to recent data and resistance to short-term noise.
The mathematical formula for QUEMA is:
QUEMA=4×EMA1−6×EMA2+4×EMA3−EMA4
This formula results in a moving average that is smoother than a triple EMA (TEMA) and provides a better response to price trends without excessive lag.
QuintEMA (Quintuple Exponential Moving Average)
The QuintEMA goes one step further by applying the EMA calculation five times in a row. This level of exponential smoothing is useful for identifying strong, persistent trends while remaining adaptive to recent price shifts.
The QuintEMA is calculated as :
QuintEMA=5×EMA1−10×EMA2+10×EMA3−5×EMA4+EMA5
The additional layer in QuintEMA further reduces the impact of short-term price fluctuations, making it especially useful in strongly trending markets.
The Smart Ribbon V2 combines the benefits of several moving average types to deliver a versatile tool for analyzing market trends, momentum, and potential reversals. With QUEMA and QuintEMA as advanced options, it allows traders to tailor the indicator to match their preferred trading style, whether it involves higher responsiveness or smoother trend visualization. This adaptability makes Smart Ribbon V2 a powerful choice for both novice and experienced traders seeking to improve their trend-following and market analysis strategies.
The Smart Ribbon V2 helps traders:
- Identify Trend Direction
- Gauge Momentum
- Spot Trend Reversals
- Determine Entry and Exit Points
Detailed Explanation of QUEMA and QuintEMA
The QUEMA (Quadruple Exponential Moving Average) and QuintEMA (Quintuple Exponential Moving Average) are advanced smoothing techniques that build on traditional exponential moving averages (EMAs). Both offer higher sensitivity to recent price changes than standard EMAs by adding layers of exponential smoothing. These moving averages are particularly useful for traders looking for a more responsive indicator without the noise often present in shorter-period EMAs.
QUEMA (Quadruple Exponential Moving Average)
The QUEMA is calculated by applying the EMA calculation four times in succession. This method smooths out fluctuations in the price data, creating a balance between sensitivity to recent data and resistance to short-term noise.
The mathematical formula for QUEMA is:
QUEMA=4×EMA1−6×EMA2+4×EMA3−EMA4
This formula results in a moving average that is smoother than a triple EMA (TEMA) and provides a better response to price trends without excessive lag.
QuintEMA (Quintuple Exponential Moving Average)
The QuintEMA goes one step further by applying the EMA calculation five times in a row. This level of exponential smoothing is useful for identifying strong, persistent trends while remaining adaptive to recent price shifts.
The QuintEMA is calculated as :
QuintEMA=5×EMA1−10×EMA2+10×EMA3−5×EMA4+EMA5
The additional layer in QuintEMA further reduces the impact of short-term price fluctuations, making it especially useful in strongly trending markets.
The Smart Ribbon V2 combines the benefits of several moving average types to deliver a versatile tool for analyzing market trends, momentum, and potential reversals. With QUEMA and QuintEMA as advanced options, it allows traders to tailor the indicator to match their preferred trading style, whether it involves higher responsiveness or smoother trend visualization. This adaptability makes Smart Ribbon V2 a powerful choice for both novice and experienced traders seeking to improve their trend-following and market analysis strategies.
오픈 소스 스크립트
트레이딩뷰의 진정한 정신에 따라, 이 스크립트의 작성자는 이를 오픈소스로 공개하여 트레이더들이 기능을 검토하고 검증할 수 있도록 했습니다. 작성자에게 찬사를 보냅니다! 이 코드는 무료로 사용할 수 있지만, 코드를 재게시하는 경우 하우스 룰이 적용된다는 점을 기억하세요.
면책사항
해당 정보와 게시물은 금융, 투자, 트레이딩 또는 기타 유형의 조언이나 권장 사항으로 간주되지 않으며, 트레이딩뷰에서 제공하거나 보증하는 것이 아닙니다. 자세한 내용은 이용 약관을 참조하세요.
오픈 소스 스크립트
트레이딩뷰의 진정한 정신에 따라, 이 스크립트의 작성자는 이를 오픈소스로 공개하여 트레이더들이 기능을 검토하고 검증할 수 있도록 했습니다. 작성자에게 찬사를 보냅니다! 이 코드는 무료로 사용할 수 있지만, 코드를 재게시하는 경우 하우스 룰이 적용된다는 점을 기억하세요.
면책사항
해당 정보와 게시물은 금융, 투자, 트레이딩 또는 기타 유형의 조언이나 권장 사항으로 간주되지 않으며, 트레이딩뷰에서 제공하거나 보증하는 것이 아닙니다. 자세한 내용은 이용 약관을 참조하세요.