OPEN-SOURCE SCRIPT
ATR5 Gerchik&Co
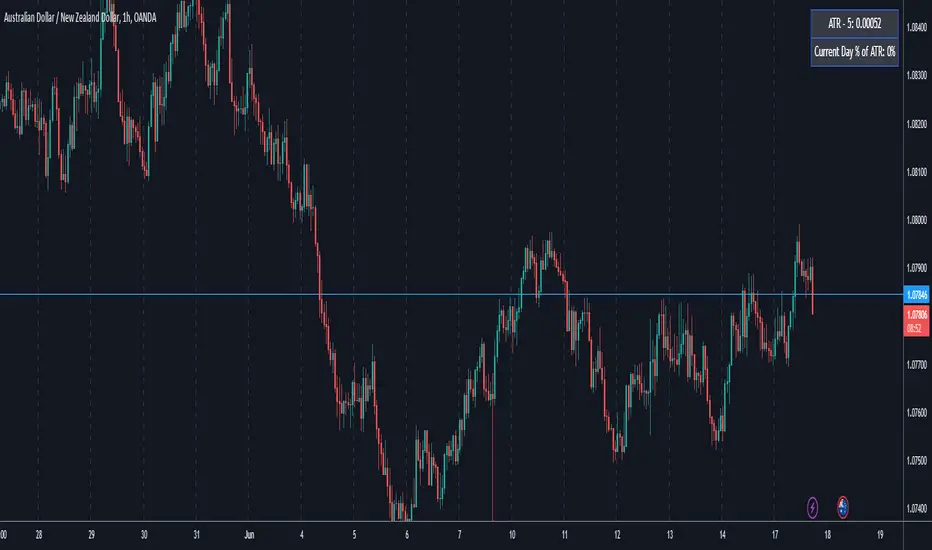
This script is designed to calculate and display the Average True Range (ATR) based on the last 5 bars on a daily (D1) chart. The ATR is a key indicator used to measure market volatility by decomposing the entire range of an asset price for that period. Additionally, the script provides a visual representation of the percentage of the current day's range relative to the calculated ATR.
How It Works
Calculation of ATR:
The script calculates the ATR by taking the high and low of each of the last 5 daily bars, computing the range for each bar, and then averaging these values.
The ATR value is then dynamically formatted based on the decimal places relevant to the asset's tick size.
Percentage of Current Day's Range:
The script also calculates the percentage of the current day's range compared to the ATR. This helps traders quickly assess how much of the average range has been covered today.
Visual Display:
The ATR value and the percentage of the current day's range are displayed in the top-right corner of the chart for easy reference.
Usage
Identifying Volatility: The ATR is a widely used indicator to identify periods of high and low volatility in the market. Traders can use this to adjust their strategies accordingly, such as widening or tightening stop-loss levels.
Entry and Exit Points: Knowing the ATR can help traders decide on optimal entry and exit points based on expected market movements.
Risk Management: By understanding the market volatility, traders can better manage their risk by adjusting position sizes and stop-loss levels.
Example
The script shows the ATR calculated over the last 5 days, formatted to match the asset's decimal places.
It also displays the current day's range as a percentage of the ATR, providing immediate insight into the day's volatility relative to the recent average.
How to Use
Apply the Script: Add the script to your TradingView chart.
Analyze the Display: Observe the ATR value and the percentage of the current day's range displayed in the top-right corner.
Make Informed Decisions: Use the information to make informed trading decisions based on the volatility and range of the asset.
Code Explanation
The script uses Pine Script v5 and includes functions to calculate the range of bars, average these ranges, and format the output appropriately. The ATR value and percentage are displayed using the table functionality to ensure clear and precise placement on the chart.
This description should provide users with a clear understanding of what the script does, how it can be used, and the concepts behind its calculations. Let me know if you need any further adjustments or additional details!
오픈 소스 스크립트
트레이딩뷰의 진정한 정신에 따라, 이 스크립트의 작성자는 이를 오픈소스로 공개하여 트레이더들이 기능을 검토하고 검증할 수 있도록 했습니다. 작성자에게 찬사를 보냅니다! 이 코드는 무료로 사용할 수 있지만, 코드를 재게시하는 경우 하우스 룰이 적용된다는 점을 기억하세요.
면책사항
해당 정보와 게시물은 금융, 투자, 트레이딩 또는 기타 유형의 조언이나 권장 사항으로 간주되지 않으며, 트레이딩뷰에서 제공하거나 보증하는 것이 아닙니다. 자세한 내용은 이용 약관을 참조하세요.
오픈 소스 스크립트
트레이딩뷰의 진정한 정신에 따라, 이 스크립트의 작성자는 이를 오픈소스로 공개하여 트레이더들이 기능을 검토하고 검증할 수 있도록 했습니다. 작성자에게 찬사를 보냅니다! 이 코드는 무료로 사용할 수 있지만, 코드를 재게시하는 경우 하우스 룰이 적용된다는 점을 기억하세요.
면책사항
해당 정보와 게시물은 금융, 투자, 트레이딩 또는 기타 유형의 조언이나 권장 사항으로 간주되지 않으며, 트레이딩뷰에서 제공하거나 보증하는 것이 아닙니다. 자세한 내용은 이용 약관을 참조하세요.