OPEN-SOURCE SCRIPT
업데이트됨 Buying Selling Ratio with Label
Automate your pinescript to Tradovate/Ninja-Trader! ninja-view.com/
The "Buying Selling Ratio with Label" indicator calculates and displays the buying and selling ratio based on volume and price movements. Here's a description of its functionality:
The indicator calculates the buying and selling volumes using the formula:
Buying = Volume * ((Close - Low) / (High - Low))
Selling = Volume * ((High - Close) / (High - Low))
This calculation determines the volume distribution between buying and selling pressure within each bar.
The indicator then calculates the Buying Selling Ratio (BSR) as a percentage using the formula:
BSR = (Buying / (Buying + Selling)) * 100
The BSR value represents the proportion of buying volume relative to the total buying and selling volume.
The BSR is plotted on the chart as a line, with colors indicating different market conditions:
If the BSR is above the overbought level (defined as 90 in this example), the line is displayed in red.
If the BSR is below the oversold level (defined as 10 in this example), the line is displayed in green.
Otherwise, the line is displayed in blue.
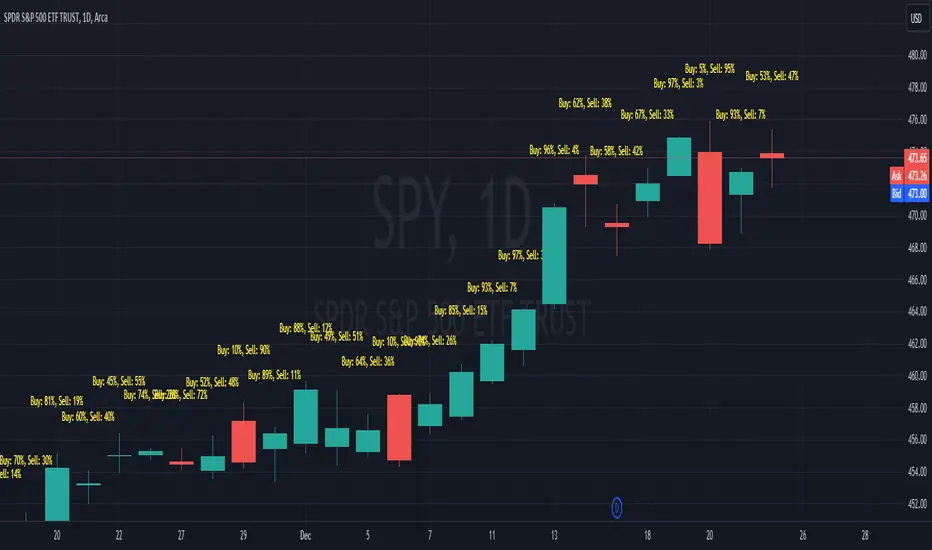
Additionally, the indicator includes labels above each bar to show the buying and selling percentages for that specific bar. The labels display the text "Buy: X%, Sell: Y%", where X represents the percentage of buying volume and Y represents the percentage of selling volume for the given bar.
By enabling the "Show Past Labels" option, the indicator displays labels for previous bars. Otherwise, it only displays the label for the latest bar.
Overall, the indicator provides insights into buying and selling pressures and their relative strengths based on volume analysis.
The "Buying Selling Ratio with Label" indicator calculates and displays the buying and selling ratio based on volume and price movements. Here's a description of its functionality:
The indicator calculates the buying and selling volumes using the formula:
Buying = Volume * ((Close - Low) / (High - Low))
Selling = Volume * ((High - Close) / (High - Low))
This calculation determines the volume distribution between buying and selling pressure within each bar.
The indicator then calculates the Buying Selling Ratio (BSR) as a percentage using the formula:
BSR = (Buying / (Buying + Selling)) * 100
The BSR value represents the proportion of buying volume relative to the total buying and selling volume.
The BSR is plotted on the chart as a line, with colors indicating different market conditions:
If the BSR is above the overbought level (defined as 90 in this example), the line is displayed in red.
If the BSR is below the oversold level (defined as 10 in this example), the line is displayed in green.
Otherwise, the line is displayed in blue.
Additionally, the indicator includes labels above each bar to show the buying and selling percentages for that specific bar. The labels display the text "Buy: X%, Sell: Y%", where X represents the percentage of buying volume and Y represents the percentage of selling volume for the given bar.
By enabling the "Show Past Labels" option, the indicator displays labels for previous bars. Otherwise, it only displays the label for the latest bar.
Overall, the indicator provides insights into buying and selling pressures and their relative strengths based on volume analysis.
릴리즈 노트
//update오픈 소스 스크립트
트레이딩뷰의 진정한 정신에 따라, 이 스크립트의 작성자는 이를 오픈소스로 공개하여 트레이더들이 기능을 검토하고 검증할 수 있도록 했습니다. 작성자에게 찬사를 보냅니다! 이 코드는 무료로 사용할 수 있지만, 코드를 재게시하는 경우 하우스 룰이 적용된다는 점을 기억하세요.
면책사항
해당 정보와 게시물은 금융, 투자, 트레이딩 또는 기타 유형의 조언이나 권장 사항으로 간주되지 않으며, 트레이딩뷰에서 제공하거나 보증하는 것이 아닙니다. 자세한 내용은 이용 약관을 참조하세요.
오픈 소스 스크립트
트레이딩뷰의 진정한 정신에 따라, 이 스크립트의 작성자는 이를 오픈소스로 공개하여 트레이더들이 기능을 검토하고 검증할 수 있도록 했습니다. 작성자에게 찬사를 보냅니다! 이 코드는 무료로 사용할 수 있지만, 코드를 재게시하는 경우 하우스 룰이 적용된다는 점을 기억하세요.
면책사항
해당 정보와 게시물은 금융, 투자, 트레이딩 또는 기타 유형의 조언이나 권장 사항으로 간주되지 않으며, 트레이딩뷰에서 제공하거나 보증하는 것이 아닙니다. 자세한 내용은 이용 약관을 참조하세요.