PROTECTED SOURCE SCRIPT
업데이트됨 Rails v2
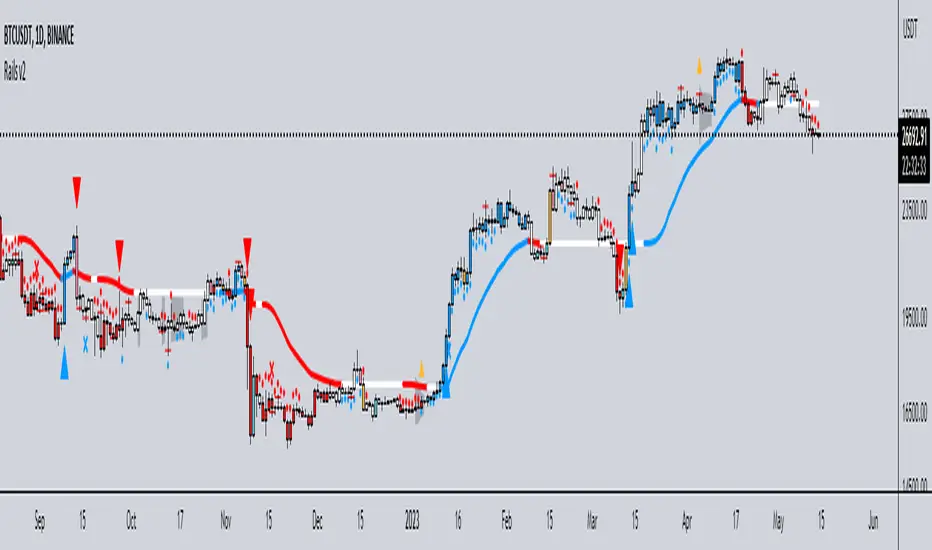
Centered around a Variable Moving Average (Rail Line). The Variable Moving Average (VMA) is a study that uses an Exponential Moving Average being able to automatically adjust its smoothing factor according to the market volatility.
In addition to the Rail Line or VMA, the indicator makes use of Bollinger Bands in two ways. First, it displays when the Bollinger Bands are in a squeeze and the potential direction of the breakout. The "squeeze" is the central concept of Bollinger Bands. When the bands come close together, constricting the moving average, it is called a squeeze. A squeeze signals a period of low volatility and is considered by traders to be a potential sign of future increased volatility and possible trading opportunities. The Bollinger Bands are also utilized to highlight when price action might reverse. This signals when price closes outside of the bands, quickly reverts and closes within the bands
The indicator makes use of the Hull Moving Average as a method to quickly capture price action moves thanks to its ability to eliminate lag while managing to improve smoothing at the same time.
Finally, the indicator utilizes Volume Point of Control (VPOC) to determine points in price where the highest amount of volume was traded. Unlike the market profile, the indicator will plot the Volume POC per candle. The script will also plot Trapped Volume. This is important as it tends to serve a signal for reversal. The more price moves away from the trapped volume, Long/Short traders might be forced to cover and price could quickly move away from the area.
DEFAULT SIGNALS: All signals can be turned Off/On by user
Dots = Short Term Trend
Rails Bar Color = Medium Term Trend
Rail Line (VMA) = Long Term Trend
Crossover of Moving Averages = X
Volume Pulse = Large Up/Down Triangle
Potential Bullish Reversal = Light Blue Candle
Potential Bearish Reversal = Pink Candle
Potential Reversal Confirmation = Orange Candle
Squeeze = Shaded White Cloud
Potential Breakout Direction = Small Golden Triangle
Hull Moving Average = Thin Golden Line
Volume POC = Thin Horizontal White Line on Candle
Volume Threshold POC = Thin Horizontal Yellow Line on Candle
Trapped Volume POC = Thin Horizontal Red Line on Candle
릴리즈 노트
ChangeLog1: adjusted HMA length to 200ChangeLog2: adjusted default color theme
보호된 스크립트입니다
이 스크립트는 비공개 소스로 게시됩니다. 하지만 이를 자유롭게 제한 없이 사용할 수 있습니다 – 자세한 내용은 여기에서 확인하세요.
면책사항
해당 정보와 게시물은 금융, 투자, 트레이딩 또는 기타 유형의 조언이나 권장 사항으로 간주되지 않으며, 트레이딩뷰에서 제공하거나 보증하는 것이 아닙니다. 자세한 내용은 이용 약관을 참조하세요.
보호된 스크립트입니다
이 스크립트는 비공개 소스로 게시됩니다. 하지만 이를 자유롭게 제한 없이 사용할 수 있습니다 – 자세한 내용은 여기에서 확인하세요.
면책사항
해당 정보와 게시물은 금융, 투자, 트레이딩 또는 기타 유형의 조언이나 권장 사항으로 간주되지 않으며, 트레이딩뷰에서 제공하거나 보증하는 것이 아닙니다. 자세한 내용은 이용 약관을 참조하세요.