OPEN-SOURCE SCRIPT
업데이트됨 BKSqueeze
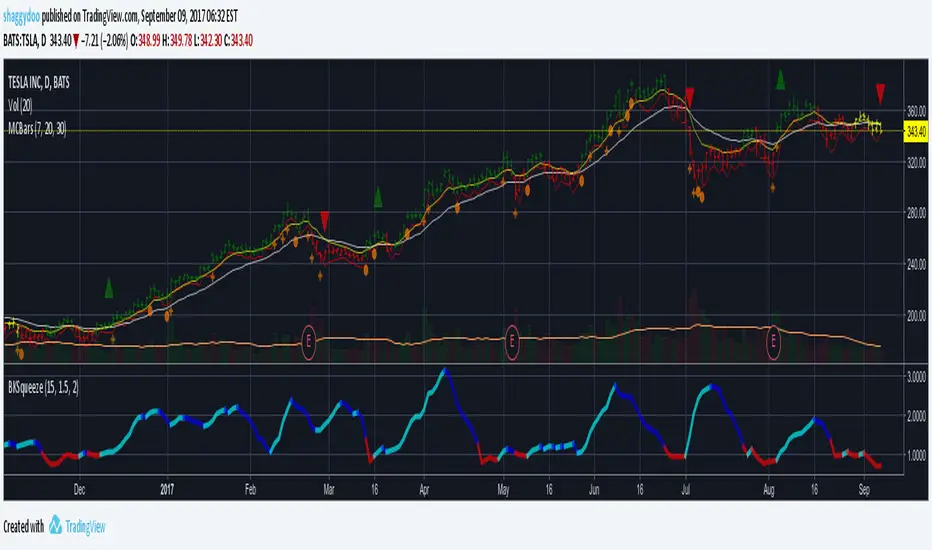
This is a price volatility compression and expansion indicator that uses the ratio of the Bollinger Band and Keltner Ratio.
Red segments indicate extreme price volatility compression that can be ideal entry points for stock/futures/forex and/or options positions.
Aqua segments indicate price volatility is expanding.
Blue segments indicate price volatility is compressing - can be used as an exit point or partial scale out point.
Note that the indicator doesn't indicate direction. One suggestion is to use the DMI indicator for this purpose - really depends on how early you enter the trade.
Suggest using a time period of 15 bars for volatile stocks, such as TSLA for example, otherwise a period of 20 bars suits most stocks/futures/forex symbols.
릴리즈 노트
Improved in-squeeze calculation - now works for all symbols including forex릴리즈 노트
Updated for consistency릴리즈 노트
Overlayed a momentum indicator for direction:Aqua bar indicates uptrend momentum is increasing.
Blue bar indicates uptrend momentum is decreasing.
Red bar indicates downtrend momentum is increasing.
Yellow bar indicates downtrend momentum is decreasing.
Also added early indication of BKRatio squeeze break out:
Orange: BKRatio in squeeze and rising - indicates potential of breakout - early indication to enter prior to breakout.
Red: BKRatio in squeeze and falling or flat - indicates still in squeeze - lower potential of breakout.
Aqua: BKRatio out of squeeze and volatility increasing - initial Aqua segment can be effective entry - depends if using stock, futures or options.
Blue: BKRatio out of squeeze and volatility decreasing - can indicate a potential exit point or scale out point.
오픈 소스 스크립트
진정한 트레이딩뷰 정신에 따라 이 스크립트 작성자는 트레이더가 기능을 검토하고 검증할 수 있도록 오픈소스로 공개했습니다. 작성자에게 찬사를 보냅니다! 무료로 사용할 수 있지만 코드를 다시 게시할 경우 하우스 룰이 적용된다는 점을 기억하세요.
면책사항
이 정보와 게시물은 TradingView에서 제공하거나 보증하는 금융, 투자, 거래 또는 기타 유형의 조언이나 권고 사항을 의미하거나 구성하지 않습니다. 자세한 내용은 이용 약관을 참고하세요.
오픈 소스 스크립트
진정한 트레이딩뷰 정신에 따라 이 스크립트 작성자는 트레이더가 기능을 검토하고 검증할 수 있도록 오픈소스로 공개했습니다. 작성자에게 찬사를 보냅니다! 무료로 사용할 수 있지만 코드를 다시 게시할 경우 하우스 룰이 적용된다는 점을 기억하세요.
면책사항
이 정보와 게시물은 TradingView에서 제공하거나 보증하는 금융, 투자, 거래 또는 기타 유형의 조언이나 권고 사항을 의미하거나 구성하지 않습니다. 자세한 내용은 이용 약관을 참고하세요.