OPEN-SOURCE SCRIPT
업데이트됨 MTF Trend Widget

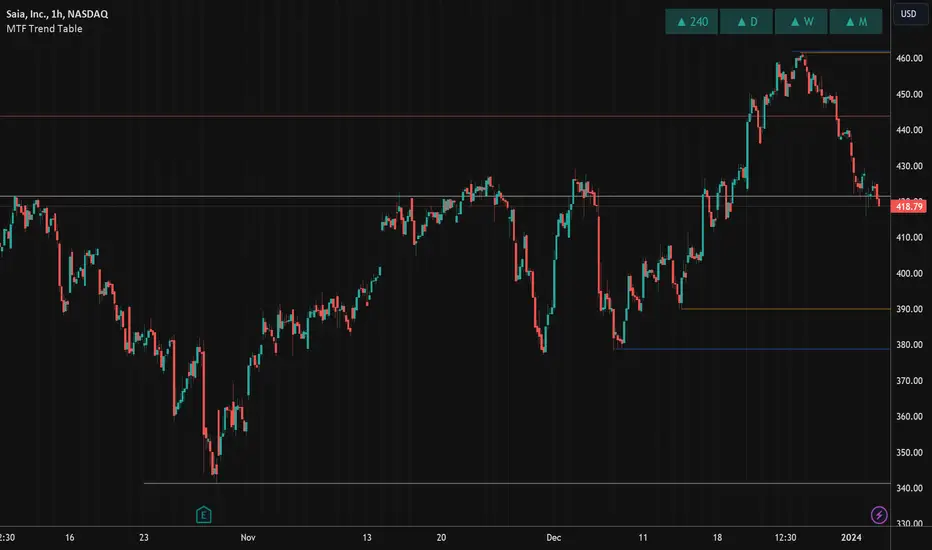
This indicator identifies trends in multiple higher timeframes (D, W, M) and shows them in a widget off to the right of the chart.
It's meant to be used as an alternative filter for "trading with the trend." Typically people use moving averages of varying lengths for this (i.e. if over 200 MA it's an uptrend, etc.), but I wanted to see if it might be more effective to see if the higher timeframes were actually trending or not in a certain direction.
For the purposes of this indicator, an uptrend is defined as higher highs and higher lows. So if currently in a downtrend and the highs are broken, the indicator will flip to an uptrend because now we have a higher high. Vice versa for downtrends.
The user can choose the lookback period for defining these highs/lows (the pivot points). A smaller lookback number will give you more frequent pivot points.
The user can toggle on visibility of all historical pivot points to make sure the frequency and placement of the swing highs/lows is to their liking.
The user can show the support/resistance lines of those most recent swing high/low points on the multiple timeframes as well.
When these lines are breached, that is when the trends change, so you can see if you are close to changing any longer term trends.
My hope is that this gives people a quick glance at the overall trend without having to cycle through different timeframes.
릴리즈 노트
This update:- Optimizes the code for improved speed (with some coding help from RozaniGhani-RG)
- Allows the user to select which timeframes they want to view the trend information on instead of that being hard coded
- Moves the information from the widget that was at the right of the chart to a table (upper right) for easier viewing at all zoom levels and to allow me to pass on the variable timeframe (which was not allowed on the widget)
- Adds additional color options for support/resistance lines to give the user greater control over how they look
Hope you guys find it useful!
릴리즈 노트
More speed optimization to limit the number of security calls. Allow for ability for user to reposition the table.릴리즈 노트
Updating to Pine v5 and adding a user input to change the thickness of the support/resistance line. The reason this is needed is that when color calculations are done (as is with the trend table) all formatting of everything else is removed from the Style tab, so must be explicitly fed to the user through the Inputs tab.릴리즈 노트
This indicator didn't work correctly on lower timeframes. As an example, if you were on a daily chart, but one if your trend boxes were for the hourly time frame, it would show you a value and show you the pivot lines for the hourly timeframe, but they weren't necessarily correct. This update grays out the boxes of lower time frames if you are on the higher time frames and makes the support resistance lines disappear when you are on the higher timeframes to remove both of those from view and not clutter with info on the lower timeframes that might not be 100% correct.릴리즈 노트
Added the ability to use close instead of wick (high/low) to determine levels and trend changes.릴리즈 노트
Added a fourth timeframe.릴리즈 노트
Bug fix where the arrow of the 4th timeframe was the same as the 3rd timeframe.릴리즈 노트
Fixed copy/paste bug where TF 4 was looking at TF 3 data.오픈 소스 스크립트
트레이딩뷰의 진정한 정신에 따라, 이 스크립트의 작성자는 이를 오픈소스로 공개하여 트레이더들이 기능을 검토하고 검증할 수 있도록 했습니다. 작성자에게 찬사를 보냅니다! 이 코드는 무료로 사용할 수 있지만, 코드를 재게시하는 경우 하우스 룰이 적용된다는 점을 기억하세요.
면책사항
해당 정보와 게시물은 금융, 투자, 트레이딩 또는 기타 유형의 조언이나 권장 사항으로 간주되지 않으며, 트레이딩뷰에서 제공하거나 보증하는 것이 아닙니다. 자세한 내용은 이용 약관을 참조하세요.
오픈 소스 스크립트
트레이딩뷰의 진정한 정신에 따라, 이 스크립트의 작성자는 이를 오픈소스로 공개하여 트레이더들이 기능을 검토하고 검증할 수 있도록 했습니다. 작성자에게 찬사를 보냅니다! 이 코드는 무료로 사용할 수 있지만, 코드를 재게시하는 경우 하우스 룰이 적용된다는 점을 기억하세요.
면책사항
해당 정보와 게시물은 금융, 투자, 트레이딩 또는 기타 유형의 조언이나 권장 사항으로 간주되지 않으며, 트레이딩뷰에서 제공하거나 보증하는 것이 아닙니다. 자세한 내용은 이용 약관을 참조하세요.