OPEN-SOURCE SCRIPT
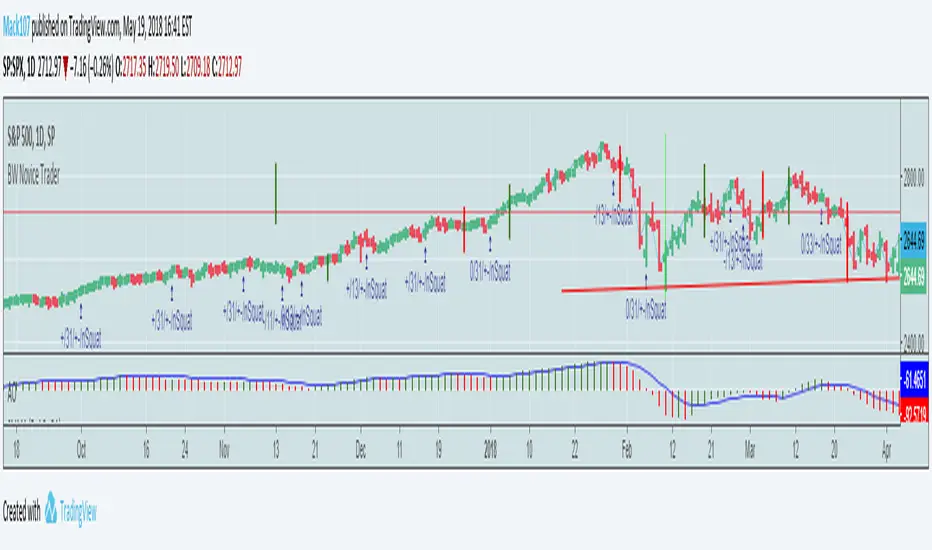
Bill Williams Trading Chaos Vol 1-Novice

This is a revision of a script developed by tekolo. I hope tekolo takes a look. The concepts are here but I struggle with pine. I am very much a novice, but I tried to put information from the original book, Trading Chaos, Volume One by Bill Williams. There are too many plots to get this to wor. I made a lot of plot lines into comments to get it to run. I'm hoping someone with an interest in this material and some programming skills will be kind enough to take these thoughts and put them in a script that the Pine Editor would actually run. Thanks for taking a look. I do believe in these leading indicators. This is information included for Novice Level Trading in the Bill Williams book. There are more indicators developed in his material, but the jest is that Price is an end result of the marketplace. Market participation (Volume), Market Bias (Momentum), Increased Participation and Bias (Acceleration) all preceed the formation of the Trend. This along with Elliott Wave interpretation using his indicators as a basis for locating key points of the Elliott Wave, are most of what I understand about this interesting man's work. Again, I am a novice at all of this, but the leading indicators that result in price seem interesting. Thanks!
오픈 소스 스크립트
트레이딩뷰의 진정한 정신에 따라, 이 스크립트의 작성자는 이를 오픈소스로 공개하여 트레이더들이 기능을 검토하고 검증할 수 있도록 했습니다. 작성자에게 찬사를 보냅니다! 이 코드는 무료로 사용할 수 있지만, 코드를 재게시하는 경우 하우스 룰이 적용된다는 점을 기억하세요.
면책사항
해당 정보와 게시물은 금융, 투자, 트레이딩 또는 기타 유형의 조언이나 권장 사항으로 간주되지 않으며, 트레이딩뷰에서 제공하거나 보증하는 것이 아닙니다. 자세한 내용은 이용 약관을 참조하세요.
오픈 소스 스크립트
트레이딩뷰의 진정한 정신에 따라, 이 스크립트의 작성자는 이를 오픈소스로 공개하여 트레이더들이 기능을 검토하고 검증할 수 있도록 했습니다. 작성자에게 찬사를 보냅니다! 이 코드는 무료로 사용할 수 있지만, 코드를 재게시하는 경우 하우스 룰이 적용된다는 점을 기억하세요.
면책사항
해당 정보와 게시물은 금융, 투자, 트레이딩 또는 기타 유형의 조언이나 권장 사항으로 간주되지 않으며, 트레이딩뷰에서 제공하거나 보증하는 것이 아닙니다. 자세한 내용은 이용 약관을 참조하세요.