OPEN-SOURCE SCRIPT
RSI Modified
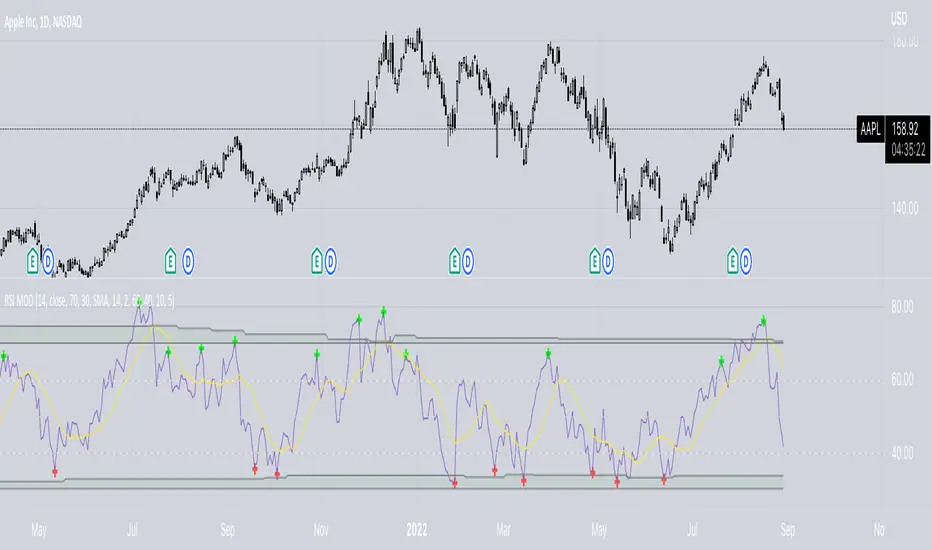
The RSI is an excellent indicator for determining when equities are overbought/oversold. Though I believe there is a shortcoming in using the 70/30 levels since they are static and do not adjust for when an equity is trending. It stands to reason that in a downtrend, the overbought might be less than 70 and the oversold less than 30—Vice versa for a bull trend. Using the built-in function of pivots, I have attempted to create overbought/oversold lines that adjust with the trend. Leaving the 70/30 lines on the indicator also helps visualize the equity trend. All pivot settings are adjustable in the input menu. The pivot limits serve as a filter for recording pivot points. For example, with an upper pivot limit of 60, only pivots greater than 60 will be recorded into the array used to determine overbought. The crosses represent which values are used to determine overbought/oversold and do not provide timely indications.
오픈 소스 스크립트
트레이딩뷰의 진정한 정신에 따라, 이 스크립트의 작성자는 이를 오픈소스로 공개하여 트레이더들이 기능을 검토하고 검증할 수 있도록 했습니다. 작성자에게 찬사를 보냅니다! 이 코드는 무료로 사용할 수 있지만, 코드를 재게시하는 경우 하우스 룰이 적용된다는 점을 기억하세요.
Checkout my free weekly market updates on substack!
ronaldryninger.substack.com
ronaldryninger.substack.com
면책사항
해당 정보와 게시물은 금융, 투자, 트레이딩 또는 기타 유형의 조언이나 권장 사항으로 간주되지 않으며, 트레이딩뷰에서 제공하거나 보증하는 것이 아닙니다. 자세한 내용은 이용 약관을 참조하세요.