PROTECTED SOURCE SCRIPT
업데이트됨 Timeframe Continuity
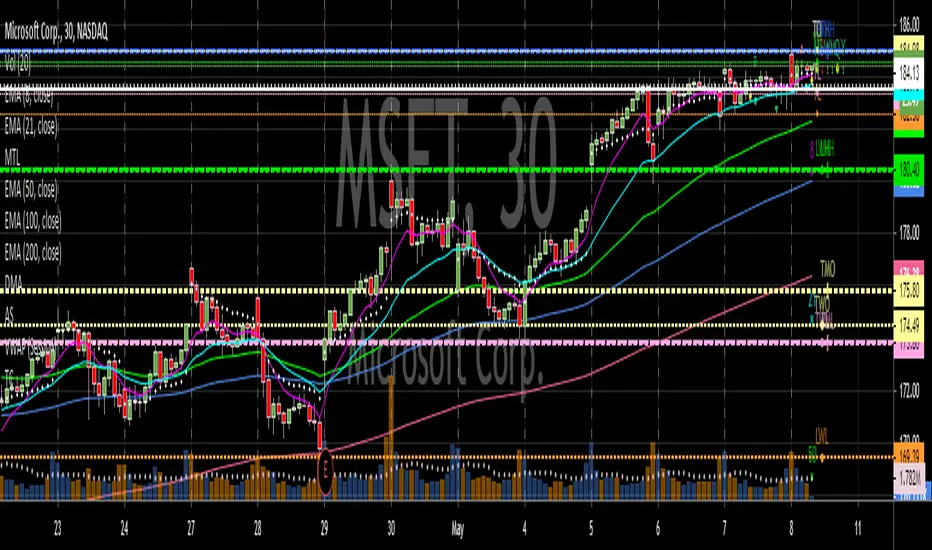
Based on Rob Smith from T3Live's "The Strat" system.
Places an indicator on the top right of the chart that shows if the current bar on the current or higher timeframe is red or green.
Allows the user to identify timeframe continuity or conflicting timeframes at a glance.
Not recommended for those who have not completed Rob's course.
Places an indicator on the top right of the chart that shows if the current bar on the current or higher timeframe is red or green.
Allows the user to identify timeframe continuity or conflicting timeframes at a glance.
Not recommended for those who have not completed Rob's course.
릴리즈 노트
Script will now draw a yellow circle behind the associated arrow if the current bar is inside.Indicator has also been moved to the bottom of the screen by default.
릴리즈 노트
Moved default location back to top.릴리즈 노트
A silver square will now display behind the associated red/green arrow if the current bar is outside.Changed location of bars to the right of the current bar to improve visibility.
This script is designed for those who view multiple symbols simultaneously and do not have the screen space to view all time frame charts at the same time.
The Strat
릴리즈 노트
No functionality changes. Corrected a naming issue in the settings menu.보호된 스크립트입니다
이 스크립트는 비공개 소스로 게시됩니다. 하지만 이를 자유롭게 제한 없이 사용할 수 있습니다 – 자세한 내용은 여기에서 확인하세요.
면책사항
해당 정보와 게시물은 금융, 투자, 트레이딩 또는 기타 유형의 조언이나 권장 사항으로 간주되지 않으며, 트레이딩뷰에서 제공하거나 보증하는 것이 아닙니다. 자세한 내용은 이용 약관을 참조하세요.
보호된 스크립트입니다
이 스크립트는 비공개 소스로 게시됩니다. 하지만 이를 자유롭게 제한 없이 사용할 수 있습니다 – 자세한 내용은 여기에서 확인하세요.
면책사항
해당 정보와 게시물은 금융, 투자, 트레이딩 또는 기타 유형의 조언이나 권장 사항으로 간주되지 않으며, 트레이딩뷰에서 제공하거나 보증하는 것이 아닙니다. 자세한 내용은 이용 약관을 참조하세요.