OPEN-SOURCE SCRIPT
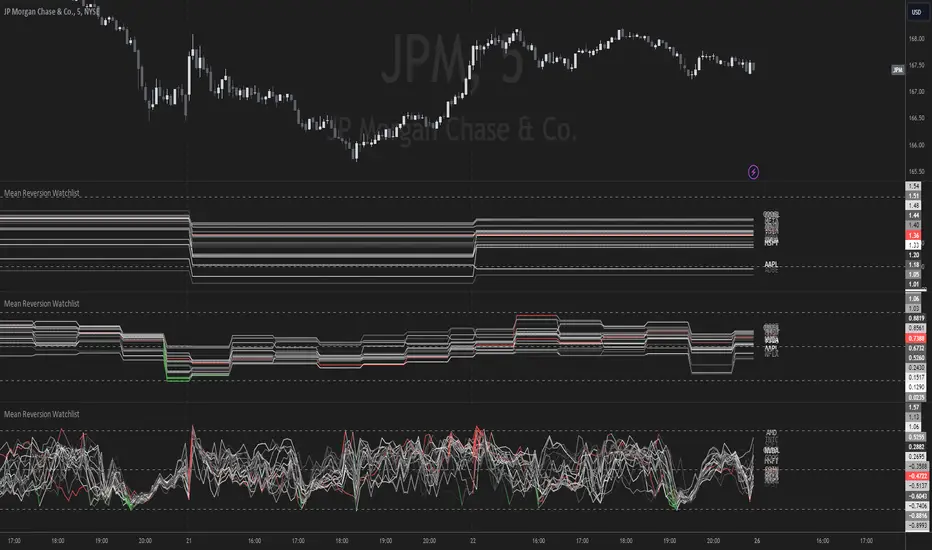
Mean Reversion Watchlist [Z score]

Hi Traders !
What is the Z score:
The Z score measures a values variability factor from the mean, this value is denoted by z and is interpreted as the number of standard deviations from the mean.
The Z score is often applied to the normal distribution to “standardize” the values; this makes comparison of normally distributed random variables with different units possible.
This popular reversal based indicator makes an assumption that the sample distribution (in this case the sample of price values) is normal, this allows for the interpretation that values with an extremely high or low percentile or “Z” value will likely be reversal zones.
This is because in the population data (the true distribution) which is known, anomaly values are very rare, therefore if price were to take a z score factor of 3 this would mean that price lies 3 standard deviations from the mean in the positive direction and is in the ≈99% percentile of all values. We would take this as a sign of a negative reversal as it is very unlikely to observe a consecutive equal to or more extreme than this percentile or Z value.
The z score normalization equation is given by

In Pine Script the Z score can be computed very easily using the below code.
Pine Script®
The Indicator:
This indicator plots the Z score for up to 20 different assets (Note the maximum is 40 however the utility of 40 plots in one indicator is not much, there is a diminishing marginal return of the number of plots).
Z score threshold levels can also be specified, the interpretation is the same as stated above.
The timeframe can also be fixed, by toggling the “Time frame lock” user input under the “TIME FRAME LOCK” user input group (Note this indicator does not repaint).
What is the Z score:
The Z score measures a values variability factor from the mean, this value is denoted by z and is interpreted as the number of standard deviations from the mean.
The Z score is often applied to the normal distribution to “standardize” the values; this makes comparison of normally distributed random variables with different units possible.
This popular reversal based indicator makes an assumption that the sample distribution (in this case the sample of price values) is normal, this allows for the interpretation that values with an extremely high or low percentile or “Z” value will likely be reversal zones.
This is because in the population data (the true distribution) which is known, anomaly values are very rare, therefore if price were to take a z score factor of 3 this would mean that price lies 3 standard deviations from the mean in the positive direction and is in the ≈99% percentile of all values. We would take this as a sign of a negative reversal as it is very unlikely to observe a consecutive equal to or more extreme than this percentile or Z value.
The z score normalization equation is given by
In Pine Script the Z score can be computed very easily using the below code.
// Z score custom function
Zscore(source, lookback) =>
sma = ta.sma(source, lookback)
stdev = ta.stdev(source, lookback, true)
zscore = (source - sma) / stdev
zscore
The Indicator:
This indicator plots the Z score for up to 20 different assets (Note the maximum is 40 however the utility of 40 plots in one indicator is not much, there is a diminishing marginal return of the number of plots).
Z score threshold levels can also be specified, the interpretation is the same as stated above.
The timeframe can also be fixed, by toggling the “Time frame lock” user input under the “TIME FRAME LOCK” user input group (Note this indicator does not repaint).
오픈 소스 스크립트
트레이딩뷰의 진정한 정신에 따라, 이 스크립트의 작성자는 이를 오픈소스로 공개하여 트레이더들이 기능을 검토하고 검증할 수 있도록 했습니다. 작성자에게 찬사를 보냅니다! 이 코드는 무료로 사용할 수 있지만, 코드를 재게시하는 경우 하우스 룰이 적용된다는 점을 기억하세요.
면책사항
해당 정보와 게시물은 금융, 투자, 트레이딩 또는 기타 유형의 조언이나 권장 사항으로 간주되지 않으며, 트레이딩뷰에서 제공하거나 보증하는 것이 아닙니다. 자세한 내용은 이용 약관을 참조하세요.
오픈 소스 스크립트
트레이딩뷰의 진정한 정신에 따라, 이 스크립트의 작성자는 이를 오픈소스로 공개하여 트레이더들이 기능을 검토하고 검증할 수 있도록 했습니다. 작성자에게 찬사를 보냅니다! 이 코드는 무료로 사용할 수 있지만, 코드를 재게시하는 경우 하우스 룰이 적용된다는 점을 기억하세요.
면책사항
해당 정보와 게시물은 금융, 투자, 트레이딩 또는 기타 유형의 조언이나 권장 사항으로 간주되지 않으며, 트레이딩뷰에서 제공하거나 보증하는 것이 아닙니다. 자세한 내용은 이용 약관을 참조하세요.