PROTECTED SOURCE SCRIPT
업데이트됨 Open to High/Low % Movement
to track the movement of open to low and open to high in % terms, please create a trading view pine script which can plot this movement in a separate chart
릴리즈 노트
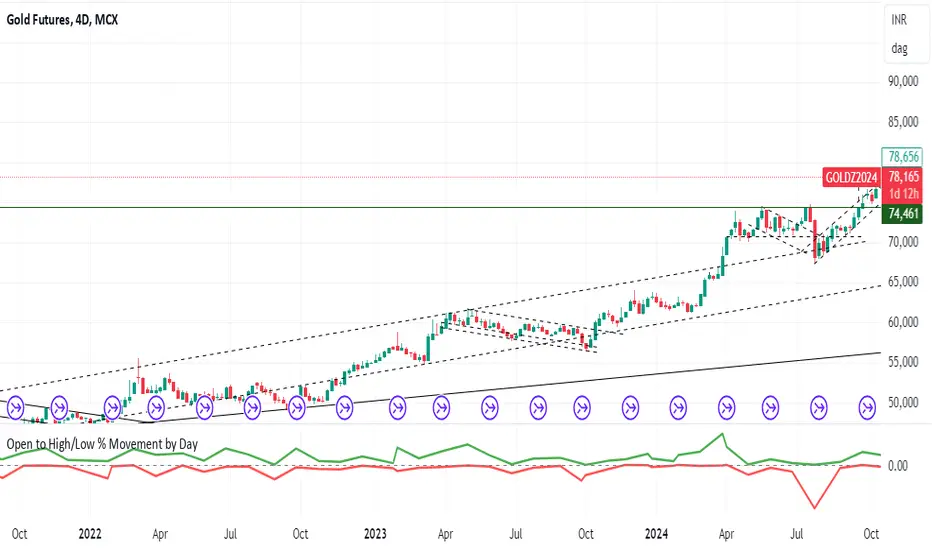
### Description of the "Open to High/Low % Movement by Day" IndicatorThis custom TradingView indicator displays the percentage movement from the open price to the high price (Open-to-High) and from the open price to the low price (Open-to-Low) for each trading day. The purpose of this indicator is to help traders analyze the intraday price volatility relative to the open price on a given day.
#### Key Features:
1. **Open-to-High and Open-to-Low Movement**:
- The indicator calculates the percentage change from the open price to both the highest and lowest points of each trading session.
- Positive values (green line) represent the percentage increase from the open to the high, while negative values (red line) represent the decrease from the open to the low.
2. **Day Filter**:
- A unique feature of this indicator is the ability to filter the data by a specific day of the week (from Monday to Friday).
- By selecting a specific day in the settings, users can isolate and view data only for that day (e.g., Mondays) to analyze weekday-specific trends.
- Setting the day filter to "All Days" will display data for every trading day.
3. **Separate Chart Pane**:
- The indicator is displayed in a separate pane below the main price chart, helping to keep the main chart uncluttered while providing a clear view of percentage movements.
4. **Reference Zero Line**:
- A horizontal zero line is included to help differentiate positive and negative movements relative to the open price.
#### How to Use:
- **Identify Trends for Specific Days**: By selecting a specific day, traders can analyze if a particular weekday consistently exhibits certain patterns, such as larger-than-average movements.
- **Measure Intraday Volatility**: This indicator can help traders quickly see how volatile a particular day is compared to others, as it shows both upward and downward movement percentages.
- **Assess Market Sentiment**: Large positive or negative movements relative to the open may indicate strong buying or selling pressure, providing potential insight into market sentiment on a given day.
This tool can be valuable for day traders and swing traders looking to identify patterns based on intraday volatility across different days of the week.
보호된 스크립트입니다
이 스크립트는 비공개 소스로 게시됩니다. 하지만 이를 자유롭게 제한 없이 사용할 수 있습니다 – 자세한 내용은 여기에서 확인하세요.
면책사항
해당 정보와 게시물은 금융, 투자, 트레이딩 또는 기타 유형의 조언이나 권장 사항으로 간주되지 않으며, 트레이딩뷰에서 제공하거나 보증하는 것이 아닙니다. 자세한 내용은 이용 약관을 참조하세요.
면책사항
해당 정보와 게시물은 금융, 투자, 트레이딩 또는 기타 유형의 조언이나 권장 사항으로 간주되지 않으며, 트레이딩뷰에서 제공하거나 보증하는 것이 아닙니다. 자세한 내용은 이용 약관을 참조하세요.