OPEN-SOURCE SCRIPT
Nasan Market Phase Classifier
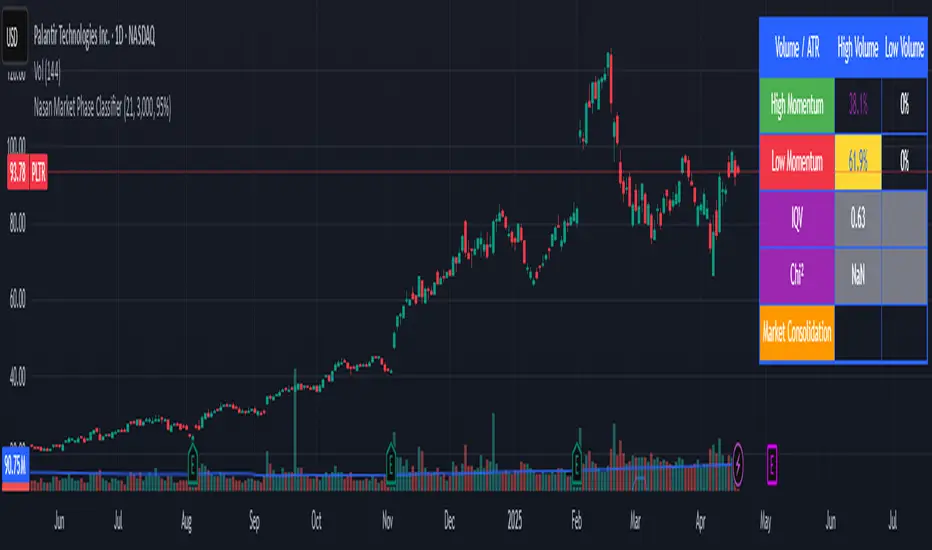
The Nasan Market Phase Classifier indicator designed to classify market phases using volume, volatility (or momentum), and statistical analysis. Here's a summary of how it works and what it does:
🔍 Core Concept
This indicator classifies the market into four phases based on volume and ATR (or optionally momentum):
High Volume / High ATR or Momentum (HV/HATR): Strong Trend
Low Volume / High ATR or Momentum (LV/HATR): False Breakout / Exhaustion
High Volume / Low ATR or Momentum (HV/LATR): Consolidation
Low Volume / Low ATR or Momentum (LV/LATR): Stagnation
⚙️ Key Settings
Short-Term Length: Used for the active market phase.
Long-Term Length: Used as the expected/benchmark distribution.
Use Momentum: Replaces volatility (ATR) with momentum (custom ROC-based formula).
Use Fixed Alpha: Toggles adaptive vs. fixed weighting in scoring (this is based on variation of the volatility - standard deviation of true range).
📊 How It Works
Volatility or Momentum Scoring:
Uses ATR-based or Momentum-based score depending on the setting.
Applies weighing (alpha) which is based on variability of the volatility itself.
Market Phase Count:
Measures how often each of the 4 volume/volatility combinations occur in:
Short-term window (observed phase)
Long-term window (expected distribution)
Category Proportions:
Calculates percentage share of each category (e.g., % time in HV/HATR).
Plots these on chart to visually see market phase dominance (can be used for screening of pine screener).
Statistical Testing:
IQV (Index of Qualitative Variation): Measures phase diversity (0 = focused, 1 = mixed).
Chi-Squared Test: Compares current vs. historical phase distribution.
Z-Test: Tests if current phase dominance is statistically significant.
📋 Outputs
On-Chart Plots and Tabels:
Strong Trend, False Breakout/Exhaustion, Consolidation, Stagnation
Strength Quality Plot: Trend strength normalized by IQV.
Dynamic Table (Top Right):
Shows each phase’s proportion (the current phase cell is highlighted in yellow), IQV, Chi² value, and current dominant phase. The current candle classification (text) is in purple.
Highlights the dominant phase classification and color-codes significance (the cell highlighted in green highly confident about the classification, orange intermediate confidence and red low confidence). This color coding is not just based on statistical significance it is based on IQV which takes into account how spread the proportions are.
🧠 Interpretation
A dominant HV/HATR phase with low IQV and high Z-Score indicates a strong and statistically significant trend.
High IQV suggests uncertainty or mixed market behavior.
Chi² spike indicates a shift from historical behavior can be used to see is the market behavior changing by changing the long term length say to 252 and short term length to 21 this will tell if the short term behavior is different from the past 252 day behavior.
오픈 소스 스크립트
트레이딩뷰의 진정한 정신에 따라, 이 스크립트의 작성자는 이를 오픈소스로 공개하여 트레이더들이 기능을 검토하고 검증할 수 있도록 했습니다. 작성자에게 찬사를 보냅니다! 이 코드는 무료로 사용할 수 있지만, 코드를 재게시하는 경우 하우스 룰이 적용된다는 점을 기억하세요.
면책사항
해당 정보와 게시물은 금융, 투자, 트레이딩 또는 기타 유형의 조언이나 권장 사항으로 간주되지 않으며, 트레이딩뷰에서 제공하거나 보증하는 것이 아닙니다. 자세한 내용은 이용 약관을 참조하세요.
오픈 소스 스크립트
트레이딩뷰의 진정한 정신에 따라, 이 스크립트의 작성자는 이를 오픈소스로 공개하여 트레이더들이 기능을 검토하고 검증할 수 있도록 했습니다. 작성자에게 찬사를 보냅니다! 이 코드는 무료로 사용할 수 있지만, 코드를 재게시하는 경우 하우스 룰이 적용된다는 점을 기억하세요.
면책사항
해당 정보와 게시물은 금융, 투자, 트레이딩 또는 기타 유형의 조언이나 권장 사항으로 간주되지 않으며, 트레이딩뷰에서 제공하거나 보증하는 것이 아닙니다. 자세한 내용은 이용 약관을 참조하세요.