OPEN-SOURCE SCRIPT
업데이트됨 KRMJ MA
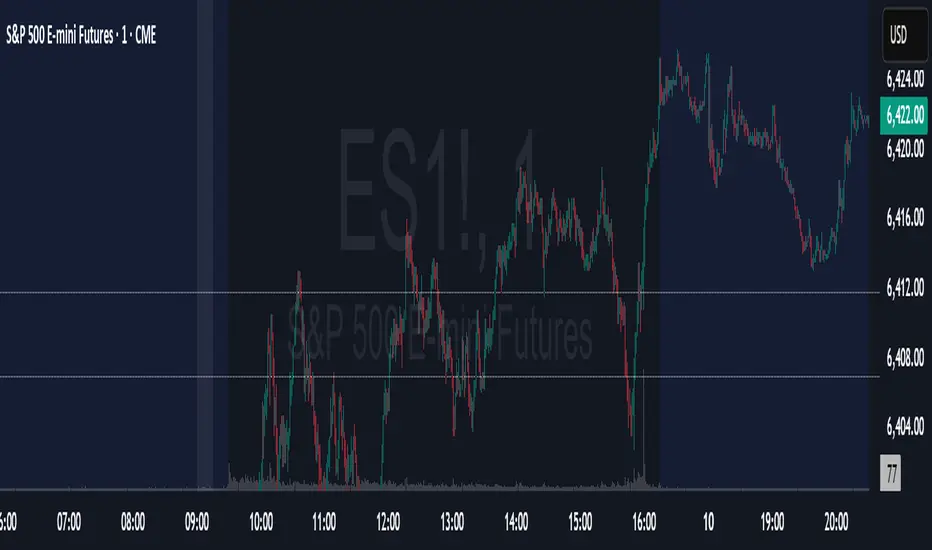
overlays four moving averages on a TradingView chart to help traders identify trend direction, momentum shifts, and dynamic support or resistance levels. It includes a 9-period EMA, 21-period EMA, 20-period SMA, and a 200-period EMA. Each moving average serves a specific role: the 9 EMA responds quickly to price changes and highlights short-term momentum; the 21 EMA smooths out price action slightly more and confirms near-term trends. The 20 SMA provides a simple mid-range trend baseline often used in mean-reversion strategies or range-bound environments. The 200 EMA, a widely recognized long-term trend filter, helps users gauge the dominant market direction.
릴리즈 노트
The KRMJ Indicator plots four hidden moving averages (13 EMA, 21 EMA, 20 SMA, 200 EMA) for reference, and automatically draws a light-blue dotted horizontal line each day from the 00:00 open price to 15:59, providing a clear visual reference for the day’s midnight session level.오픈 소스 스크립트
트레이딩뷰의 진정한 정신에 따라, 이 스크립트의 작성자는 이를 오픈소스로 공개하여 트레이더들이 기능을 검토하고 검증할 수 있도록 했습니다. 작성자에게 찬사를 보냅니다! 이 코드는 무료로 사용할 수 있지만, 코드를 재게시하는 경우 하우스 룰이 적용된다는 점을 기억하세요.
면책사항
해당 정보와 게시물은 금융, 투자, 트레이딩 또는 기타 유형의 조언이나 권장 사항으로 간주되지 않으며, 트레이딩뷰에서 제공하거나 보증하는 것이 아닙니다. 자세한 내용은 이용 약관을 참조하세요.
오픈 소스 스크립트
트레이딩뷰의 진정한 정신에 따라, 이 스크립트의 작성자는 이를 오픈소스로 공개하여 트레이더들이 기능을 검토하고 검증할 수 있도록 했습니다. 작성자에게 찬사를 보냅니다! 이 코드는 무료로 사용할 수 있지만, 코드를 재게시하는 경우 하우스 룰이 적용된다는 점을 기억하세요.
면책사항
해당 정보와 게시물은 금융, 투자, 트레이딩 또는 기타 유형의 조언이나 권장 사항으로 간주되지 않으며, 트레이딩뷰에서 제공하거나 보증하는 것이 아닙니다. 자세한 내용은 이용 약관을 참조하세요.