OPEN-SOURCE SCRIPT
Unseen Pivot Points
This script takes the standard TV pivot points indicator and extend it to new Pivot levels never unrevealed before.
In short: I applied the formula of traditional Pivots to calculate R6 to R10 and S6 to S10 Pivots into a new Indicator.
As you probably know, there are not more than five levels of Support or Resistance in each direction when it comes to Pivots. Why is it that Chartists don't use more than those five Pivot levels? As a historical search have yield no real answer I could only speculate that simply no one ever bothered to calculate them since markets did not put that to the question with their volatility, price behavior and returns.
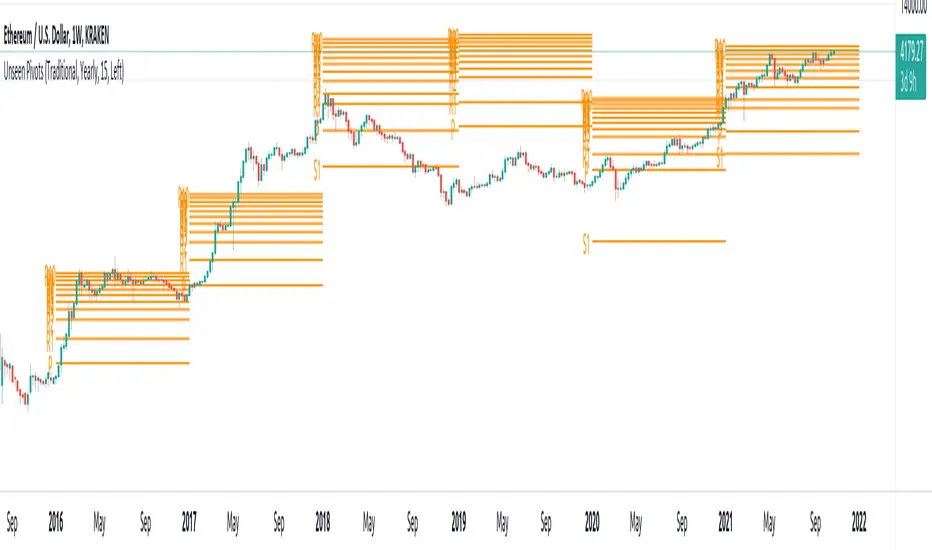
But I also speculated that plotting more pivots, especially to the upside, can serve as a road map for exponential assets like the ones we got used to in the last years, i.e. Crypto markets.
And indeed have more pivots turns out to be surprisingly useful when it comes to mooning assets.
I have applyed the same calculation from the R3/S3 on and rolled it into the creation of the R6/S6 like this:
R6 = PP * 5 + (HIGHprev - 5 * LOWprev) S5 = PP * 5 - (5 * HIGHprev - LOWprev)
And so forth until R10/S10. Not a rocket science!
Enjoy!
In short: I applied the formula of traditional Pivots to calculate R6 to R10 and S6 to S10 Pivots into a new Indicator.
As you probably know, there are not more than five levels of Support or Resistance in each direction when it comes to Pivots. Why is it that Chartists don't use more than those five Pivot levels? As a historical search have yield no real answer I could only speculate that simply no one ever bothered to calculate them since markets did not put that to the question with their volatility, price behavior and returns.
But I also speculated that plotting more pivots, especially to the upside, can serve as a road map for exponential assets like the ones we got used to in the last years, i.e. Crypto markets.
And indeed have more pivots turns out to be surprisingly useful when it comes to mooning assets.
I have applyed the same calculation from the R3/S3 on and rolled it into the creation of the R6/S6 like this:
R6 = PP * 5 + (HIGHprev - 5 * LOWprev) S5 = PP * 5 - (5 * HIGHprev - LOWprev)
And so forth until R10/S10. Not a rocket science!
Enjoy!
오픈 소스 스크립트
트레이딩뷰의 진정한 정신에 따라, 이 스크립트의 작성자는 이를 오픈소스로 공개하여 트레이더들이 기능을 검토하고 검증할 수 있도록 했습니다. 작성자에게 찬사를 보냅니다! 이 코드는 무료로 사용할 수 있지만, 코드를 재게시하는 경우 하우스 룰이 적용된다는 점을 기억하세요.
면책사항
해당 정보와 게시물은 금융, 투자, 트레이딩 또는 기타 유형의 조언이나 권장 사항으로 간주되지 않으며, 트레이딩뷰에서 제공하거나 보증하는 것이 아닙니다. 자세한 내용은 이용 약관을 참조하세요.
오픈 소스 스크립트
트레이딩뷰의 진정한 정신에 따라, 이 스크립트의 작성자는 이를 오픈소스로 공개하여 트레이더들이 기능을 검토하고 검증할 수 있도록 했습니다. 작성자에게 찬사를 보냅니다! 이 코드는 무료로 사용할 수 있지만, 코드를 재게시하는 경우 하우스 룰이 적용된다는 점을 기억하세요.
면책사항
해당 정보와 게시물은 금융, 투자, 트레이딩 또는 기타 유형의 조언이나 권장 사항으로 간주되지 않으며, 트레이딩뷰에서 제공하거나 보증하는 것이 아닙니다. 자세한 내용은 이용 약관을 참조하세요.