OPEN-SOURCE SCRIPT
업데이트됨 Swing-Based Volatility Index

Swing-Based Volatility Index
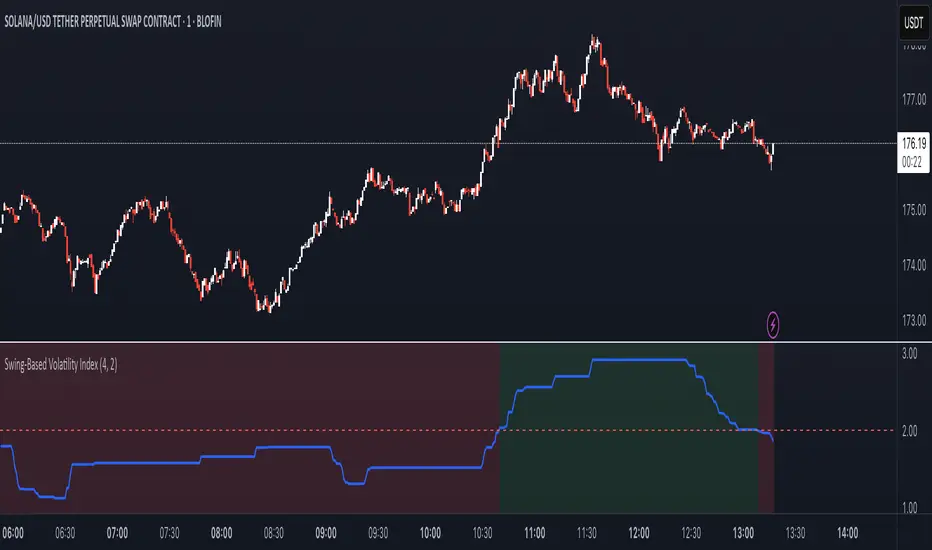
This indicator helps traders quickly determine whether the market has moved enough over the past few hours to justify scalping.
It measures the percentage price swing (high to low) over a configurable time window (e.g., last 4–8 hours) and compares it to a minimum threshold (e.g., 1%).
✅ If the percent move exceeds the threshold → Market is volatile enough to scalp (green background).
🚫 If it's below the threshold → Market is too quiet (red background).
Features:
Adjustable lookback period in hours
Custom threshold for volatility sensitivity
Automatically adapts to the current chart timeframe
This tool is ideal for scalpers and short-term traders who want to avoid entering trades in low-volatility environments.
릴리즈 노트
📊 Swing-Based Volatility IndexThe Swing-Based Volatility Index is a tool for short-term traders and scalpers that evaluates whether the market has shown enough recent movement to justify initiating trades.
🧠 How It Works
This indicator measures the percentage swing between the highest and lowest prices over a user-defined lookback period (in hours). It dynamically calculates how many candles that represents based on the chart's current timeframe.
It then computes:
Swing % = (Highest High - Lowest Low) / Lowest Low × 100
This swing percentage is compared to a minimum volatility threshold (e.g., 1%). If the market has moved more than the threshold, it's considered sufficiently volatile for scalping.
✅ Signal Conditions
Green Background = Swing % exceeds your threshold → market is active, favorable for scalping.
Red Background = Swing % is below your threshold → market is calm, avoid trades.
⚙️ Features
Adjustable lookback period (in hours)
Configurable volatility threshold
Automatically adapts to any chart timeframe
Visual background coloring to guide decision-making
🎯 Use Case
This indicator is best used as a volatility filter before entering trades. It helps avoid choppy, range-bound environments where scalping strategies may perform poorly. Instead, it highlights conditions where price has moved significantly over recent hours — often indicating momentum or breakout potential.
Updated Indicator Name.
오픈 소스 스크립트
트레이딩뷰의 진정한 정신에 따라, 이 스크립트의 작성자는 이를 오픈소스로 공개하여 트레이더들이 기능을 검토하고 검증할 수 있도록 했습니다. 작성자에게 찬사를 보냅니다! 이 코드는 무료로 사용할 수 있지만, 코드를 재게시하는 경우 하우스 룰이 적용된다는 점을 기억하세요.
면책사항
해당 정보와 게시물은 금융, 투자, 트레이딩 또는 기타 유형의 조언이나 권장 사항으로 간주되지 않으며, 트레이딩뷰에서 제공하거나 보증하는 것이 아닙니다. 자세한 내용은 이용 약관을 참조하세요.
오픈 소스 스크립트
트레이딩뷰의 진정한 정신에 따라, 이 스크립트의 작성자는 이를 오픈소스로 공개하여 트레이더들이 기능을 검토하고 검증할 수 있도록 했습니다. 작성자에게 찬사를 보냅니다! 이 코드는 무료로 사용할 수 있지만, 코드를 재게시하는 경우 하우스 룰이 적용된다는 점을 기억하세요.
면책사항
해당 정보와 게시물은 금융, 투자, 트레이딩 또는 기타 유형의 조언이나 권장 사항으로 간주되지 않으며, 트레이딩뷰에서 제공하거나 보증하는 것이 아닙니다. 자세한 내용은 이용 약관을 참조하세요.