OPEN-SOURCE SCRIPT
William Fractals + Signals
Williams Fractals + Trading Signals
This indicator identifies Williams Fractals and generates trading signals based on price sweeps of these fractal levels.
Williams Fractals are specific candlestick patterns that identify potential market turning points. Each fractal requires a minimum of 5 bars (2 before, 1 center, 2 after), though this indicator allows you to customize the number of bars checked.
Up Fractal (High Point) forms when you have a center bar whose HIGH is higher than the highs of 'n' bars before and after it. For example, with n=2, you'd see a pattern where the center bar's high is higher than 2 bars before and 2 bars after it. The indicator also recognizes patterns where up to 4 bars after the center can have equal highs before requiring a lower high.
Down Fractal (Low Point) forms when you have a center bar whose LOW is lower than the lows of 'n' bars before and after it. For example, with n=2, you'd see a pattern where the center bar's low is lower than 2 bars before and 2 bars after it. The indicator also recognizes patterns where up to 4 bars after the center can have equal lows before requiring a higher low.
Trading Signals:
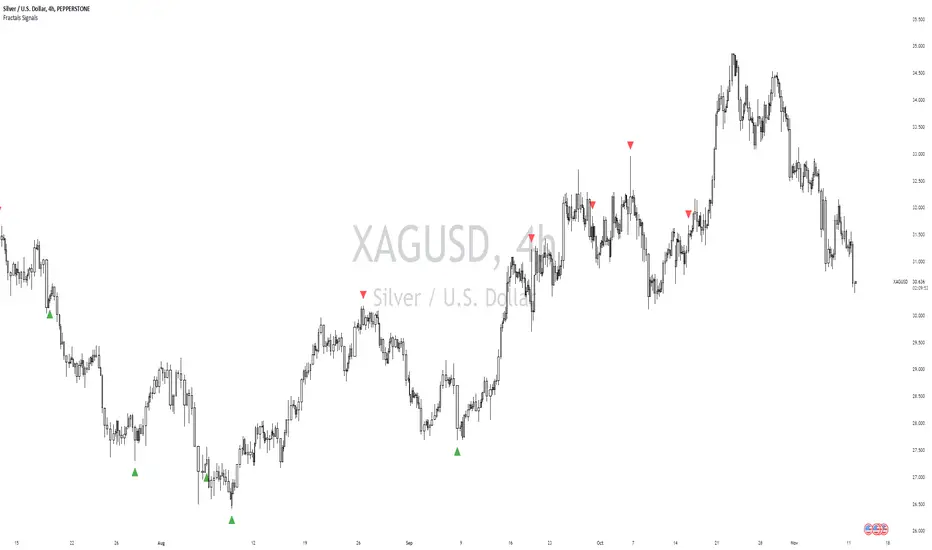
The indicator generates signals when price "sweeps" these fractal levels:
Buy Signal (Green Triangle) triggers when price sweeps a down fractal. This requires price to go BELOW the down fractal's low level and then CLOSE ABOVE it . This pattern often indicates a failed breakdown and potential reversal upward.
Sell Signal (Red Triangle) triggers when price sweeps an up fractal. This requires price to go ABOVE the up fractal's high level and then CLOSE BELOW it. This pattern often indicates a failed breakout and potential reversal downward.
Customizable Settings:
1. Periods (default: 10) - How many bars to check before and after the center bar (minimum value: 2)
2. Maximum Stored Fractals (default: 1) - How many fractal levels to keep in memory. Older levels are removed when this limit is reached to prevent excessive signals and maintain indicator performance.
Important Notes:
• The indicator checks the actual HIGH and LOW prices of each bar, not just closing prices
• Fractal levels are automatically removed after generating a signal to prevent repeated triggers
• Signals are only generated on bar close to avoid false triggers
• Alerts include the ticker symbol and the exact price level where the sweep occurred
Common Use Cases:
• Identifying potential reversal points
• Finding stop-hunt levels where price might reverse
• Setting stop-loss levels above up fractals or below down fractals
• Trading failed breakouts/breakdowns at fractal levels
This indicator identifies Williams Fractals and generates trading signals based on price sweeps of these fractal levels.
Williams Fractals are specific candlestick patterns that identify potential market turning points. Each fractal requires a minimum of 5 bars (2 before, 1 center, 2 after), though this indicator allows you to customize the number of bars checked.
Up Fractal (High Point) forms when you have a center bar whose HIGH is higher than the highs of 'n' bars before and after it. For example, with n=2, you'd see a pattern where the center bar's high is higher than 2 bars before and 2 bars after it. The indicator also recognizes patterns where up to 4 bars after the center can have equal highs before requiring a lower high.
Down Fractal (Low Point) forms when you have a center bar whose LOW is lower than the lows of 'n' bars before and after it. For example, with n=2, you'd see a pattern where the center bar's low is lower than 2 bars before and 2 bars after it. The indicator also recognizes patterns where up to 4 bars after the center can have equal lows before requiring a higher low.
Trading Signals:
The indicator generates signals when price "sweeps" these fractal levels:
Buy Signal (Green Triangle) triggers when price sweeps a down fractal. This requires price to go BELOW the down fractal's low level and then CLOSE ABOVE it . This pattern often indicates a failed breakdown and potential reversal upward.
Sell Signal (Red Triangle) triggers when price sweeps an up fractal. This requires price to go ABOVE the up fractal's high level and then CLOSE BELOW it. This pattern often indicates a failed breakout and potential reversal downward.
Customizable Settings:
1. Periods (default: 10) - How many bars to check before and after the center bar (minimum value: 2)
2. Maximum Stored Fractals (default: 1) - How many fractal levels to keep in memory. Older levels are removed when this limit is reached to prevent excessive signals and maintain indicator performance.
Important Notes:
• The indicator checks the actual HIGH and LOW prices of each bar, not just closing prices
• Fractal levels are automatically removed after generating a signal to prevent repeated triggers
• Signals are only generated on bar close to avoid false triggers
• Alerts include the ticker symbol and the exact price level where the sweep occurred
Common Use Cases:
• Identifying potential reversal points
• Finding stop-hunt levels where price might reverse
• Setting stop-loss levels above up fractals or below down fractals
• Trading failed breakouts/breakdowns at fractal levels
오픈 소스 스크립트
트레이딩뷰의 진정한 정신에 따라, 이 스크립트의 작성자는 이를 오픈소스로 공개하여 트레이더들이 기능을 검토하고 검증할 수 있도록 했습니다. 작성자에게 찬사를 보냅니다! 이 코드는 무료로 사용할 수 있지만, 코드를 재게시하는 경우 하우스 룰이 적용된다는 점을 기억하세요.
면책사항
해당 정보와 게시물은 금융, 투자, 트레이딩 또는 기타 유형의 조언이나 권장 사항으로 간주되지 않으며, 트레이딩뷰에서 제공하거나 보증하는 것이 아닙니다. 자세한 내용은 이용 약관을 참조하세요.
오픈 소스 스크립트
트레이딩뷰의 진정한 정신에 따라, 이 스크립트의 작성자는 이를 오픈소스로 공개하여 트레이더들이 기능을 검토하고 검증할 수 있도록 했습니다. 작성자에게 찬사를 보냅니다! 이 코드는 무료로 사용할 수 있지만, 코드를 재게시하는 경우 하우스 룰이 적용된다는 점을 기억하세요.
면책사항
해당 정보와 게시물은 금융, 투자, 트레이딩 또는 기타 유형의 조언이나 권장 사항으로 간주되지 않으며, 트레이딩뷰에서 제공하거나 보증하는 것이 아닙니다. 자세한 내용은 이용 약관을 참조하세요.