PROTECTED SOURCE SCRIPT
Ultimate Gann Fan Suite with Multi-Arcs
Ultimate Gann Fan Suite with Multi-Arcs
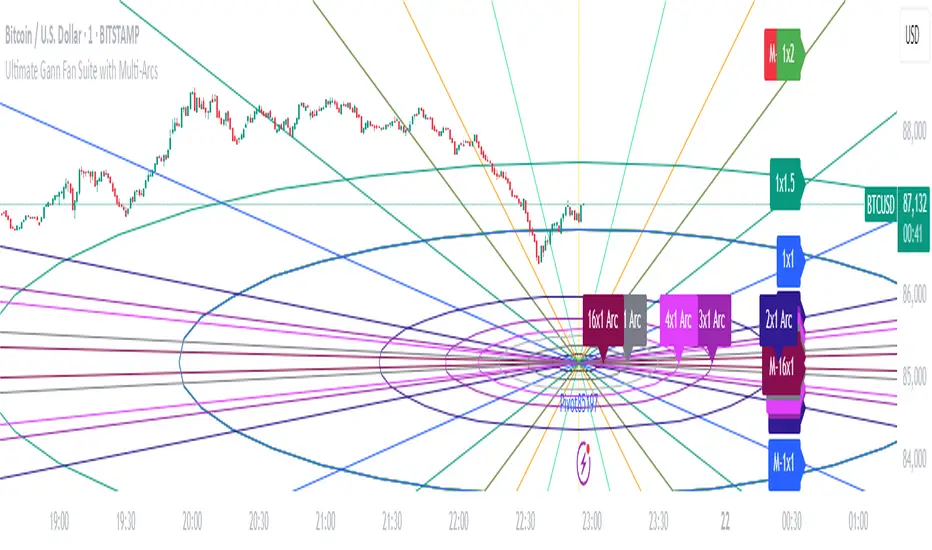
This open-source indicator plots Gann Fan angles, arcs, and levels to analyze price and time relationships based on a user-selected pivot point.
What It Does:
- Draws Gann Fan angles (1x16 to 16x1) from a pivot, with optional mirrored lines.
- Plots a base Gann arc and multi-arcs scaled by Gann ratios.
- Displays a Square of 9 grid and Gann Square levels for price projections.
- Supports custom timeframes and price types for pivot selection.
How to Use:
- Pivot: Enable manual pivot picking and select a price type (e.g., Close, High).
- Timeframe: Choose a timeframe (e.g., Daily) for pivot data.
- Angles and Arcs: Show/hide specific Gann angles, arcs, or levels; adjust colors and line styles.
- Scaling: Set price scale (e.g., 9.0) and arc radius (e.g., 36) for visual clarity.
- Labels: Enable labels to identify angles and levels.
- Best for stocks, forex, or crypto on daily or weekly charts.
Notes:
- Ensure enough chart history for the selected timeframe.
- Use on assets with clear trends or cycles for best results.
- Adjust settings to balance chart readability.
보호된 스크립트입니다
이 스크립트는 비공개 소스로 게시됩니다. 하지만 이를 자유롭게 제한 없이 사용할 수 있습니다 – 자세한 내용은 여기에서 확인하세요.
면책사항
해당 정보와 게시물은 금융, 투자, 트레이딩 또는 기타 유형의 조언이나 권장 사항으로 간주되지 않으며, 트레이딩뷰에서 제공하거나 보증하는 것이 아닙니다. 자세한 내용은 이용 약관을 참조하세요.
면책사항
해당 정보와 게시물은 금융, 투자, 트레이딩 또는 기타 유형의 조언이나 권장 사항으로 간주되지 않으며, 트레이딩뷰에서 제공하거나 보증하는 것이 아닙니다. 자세한 내용은 이용 약관을 참조하세요.