OPEN-SOURCE SCRIPT
Green Dot with Lower BB Touch
This code is based on Dr. Wish's Green Dot indicator and all credits should go to him for this indicator. I have adapted the code described by Dr. Wish in his various blog posts and webinars.
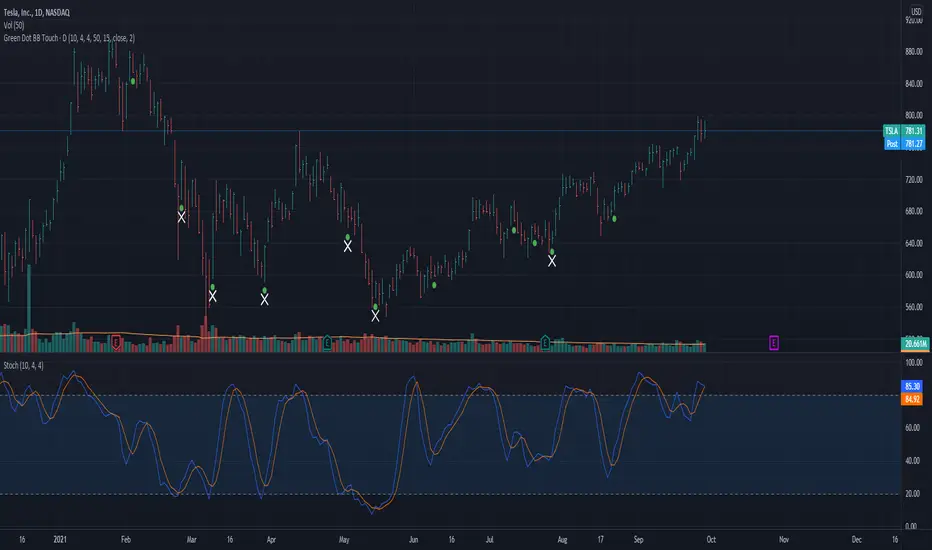
This indicator involves Stochastics and Bollinger Band indicators to provide an indication when a technically sound stock is potentially oversold and reading to resume its uptrend. This is best used in Stage 2 (Weinstein) stocks viewed on a daily chart.
The green dot appears when the fast stochastic recently crosses over the slow stochastic at the oversold (OS) threshold.
The default values for this Stochastic are 10,4,4 with an oversold (OS) threshold of 50. You can add the built-in Stochastic indicator to check this out and have a better visual as to why this works.
An added enhancement is using Bollinger Bands, specifically when the price has crossed the lower band in the past 3 days. The also plays into the themes of stocks that are following an uptrend.
The default values for the Bollinger Band portion of the indicator is a length of 15 with a standard deviation of using the stock's closing price.
I have compared this indicator with the many examples from Dr. Wish's blog and feel free to do the same to make sure it is in agreement.
I welcome your feedback and any enhancements you may suggest.
오픈 소스 스크립트
트레이딩뷰의 진정한 정신에 따라, 이 스크립트의 작성자는 이를 오픈소스로 공개하여 트레이더들이 기능을 검토하고 검증할 수 있도록 했습니다. 작성자에게 찬사를 보냅니다! 이 코드는 무료로 사용할 수 있지만, 코드를 재게시하는 경우 하우스 룰이 적용된다는 점을 기억하세요.
면책사항
해당 정보와 게시물은 금융, 투자, 트레이딩 또는 기타 유형의 조언이나 권장 사항으로 간주되지 않으며, 트레이딩뷰에서 제공하거나 보증하는 것이 아닙니다. 자세한 내용은 이용 약관을 참조하세요.
오픈 소스 스크립트
트레이딩뷰의 진정한 정신에 따라, 이 스크립트의 작성자는 이를 오픈소스로 공개하여 트레이더들이 기능을 검토하고 검증할 수 있도록 했습니다. 작성자에게 찬사를 보냅니다! 이 코드는 무료로 사용할 수 있지만, 코드를 재게시하는 경우 하우스 룰이 적용된다는 점을 기억하세요.
면책사항
해당 정보와 게시물은 금융, 투자, 트레이딩 또는 기타 유형의 조언이나 권장 사항으로 간주되지 않으며, 트레이딩뷰에서 제공하거나 보증하는 것이 아닙니다. 자세한 내용은 이용 약관을 참조하세요.