OPEN-SOURCE SCRIPT
INTELLECT_city - abcd Pattern
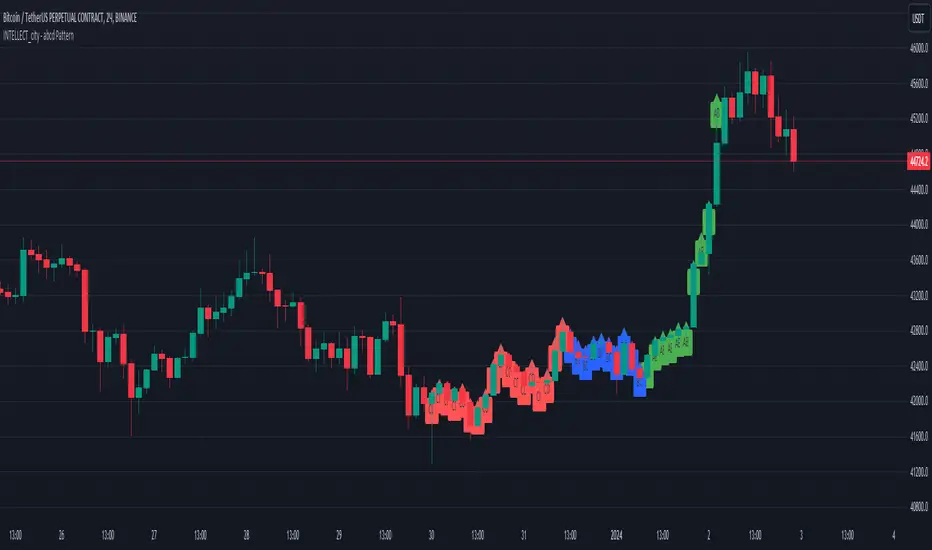
The ABCD Pattern indicator is a tool that helps identify potential geometric patterns of price movement on the chart of a financial instrument. This indicator is based on trading strategies that use the formation of four separate points, designated A, B, C and D.
Point A: The starting point of the pattern, which usually represents the end of the previous price trend.
Point B: The top of the first price wave directed against the current trend.
Point C: Completion of the second price wave started from point B. Often point C is formed at a level close to the completion of the correction.
Point D: The end point of the pattern where price forms a third wave directed towards the original trend.
The indicator displays the AB, BC and CD lines on the chart and also provides labels for these levels. This can help traders and analysts identify and analyze potential ABCD patterns on a price action chart.
It is important to remember that the ABCD Pattern does not guarantee successful trading and traders should combine it with other analysis methods and strategies to make informed decisions. Testing and adaptation to specific market conditions are also key steps when using this indicator.
오픈 소스 스크립트
트레이딩뷰의 진정한 정신에 따라, 이 스크립트의 작성자는 이를 오픈소스로 공개하여 트레이더들이 기능을 검토하고 검증할 수 있도록 했습니다. 작성자에게 찬사를 보냅니다! 이 코드는 무료로 사용할 수 있지만, 코드를 재게시하는 경우 하우스 룰이 적용된다는 점을 기억하세요.
면책사항
해당 정보와 게시물은 금융, 투자, 트레이딩 또는 기타 유형의 조언이나 권장 사항으로 간주되지 않으며, 트레이딩뷰에서 제공하거나 보증하는 것이 아닙니다. 자세한 내용은 이용 약관을 참조하세요.
오픈 소스 스크립트
트레이딩뷰의 진정한 정신에 따라, 이 스크립트의 작성자는 이를 오픈소스로 공개하여 트레이더들이 기능을 검토하고 검증할 수 있도록 했습니다. 작성자에게 찬사를 보냅니다! 이 코드는 무료로 사용할 수 있지만, 코드를 재게시하는 경우 하우스 룰이 적용된다는 점을 기억하세요.
면책사항
해당 정보와 게시물은 금융, 투자, 트레이딩 또는 기타 유형의 조언이나 권장 사항으로 간주되지 않으며, 트레이딩뷰에서 제공하거나 보증하는 것이 아닙니다. 자세한 내용은 이용 약관을 참조하세요.