PROTECTED SOURCE SCRIPT
Candle Range Theory - Higher-Timeframe Scanner
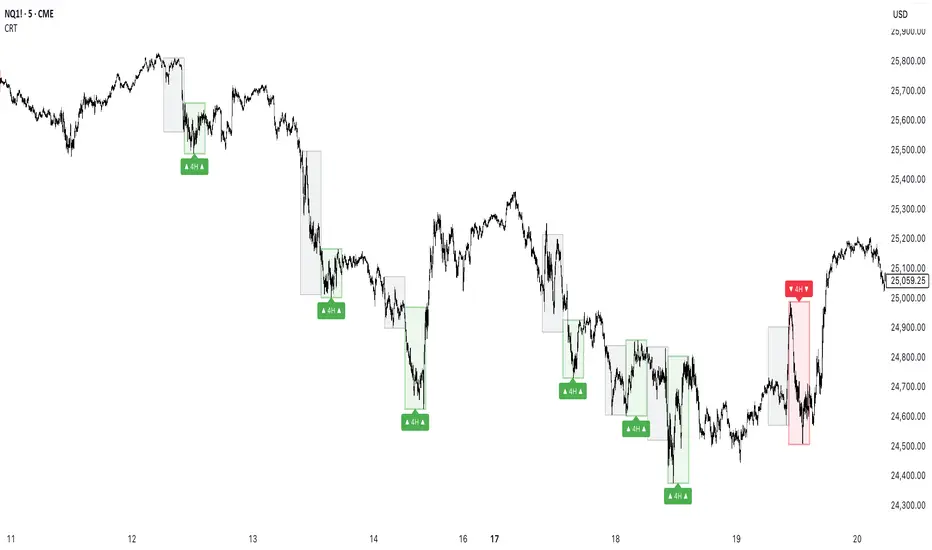
The CRT Range Scanner is a sophisticated trading tool that identifies potential Candle Range Theory (CRT) completions across multiple timeframes. Based on the Inner Circle Trader methodology, this indicator helps traders spot key market structure breaks and range expansions.
Key Features:
🔍 Higher-Timeframe Analysis: Automatically detects CRT patterns on higher timeframes while you trade on lower timeframes
🎯 Bullish & Bearish CRT Signals: Identifies both bullish (range expansion to downside) and bearish (range expansion to upside) completions
⏰ Kill Zone Filtering: Customizable trading sessions to focus only on high-probability market hours
📊 Visual Range Boxes: Clear visual representation of current and previous higher timeframe ranges
🏷️ Smart Labeling: Timeframe-specific labels for easy pattern recognition
How It Works:
Bullish CRT: Occurs when price breaks below previous low during specific session times, indicating potential bullish reversal
Bearish CRT: Occurs when price breaks above previous high during specific session times, indicating potential bearish reversal
The indicator draws colored boxes around the relevant price ranges and provides clear visual cues for pattern recognition
보호된 스크립트입니다
이 스크립트는 비공개 소스로 게시됩니다. 하지만 이를 자유롭게 제한 없이 사용할 수 있습니다 – 자세한 내용은 여기에서 확인하세요.
Luck Is What Happens When Preparation Meets Opportunity
면책사항
해당 정보와 게시물은 금융, 투자, 트레이딩 또는 기타 유형의 조언이나 권장 사항으로 간주되지 않으며, 트레이딩뷰에서 제공하거나 보증하는 것이 아닙니다. 자세한 내용은 이용 약관을 참조하세요.
보호된 스크립트입니다
이 스크립트는 비공개 소스로 게시됩니다. 하지만 이를 자유롭게 제한 없이 사용할 수 있습니다 – 자세한 내용은 여기에서 확인하세요.
Luck Is What Happens When Preparation Meets Opportunity
면책사항
해당 정보와 게시물은 금융, 투자, 트레이딩 또는 기타 유형의 조언이나 권장 사항으로 간주되지 않으며, 트레이딩뷰에서 제공하거나 보증하는 것이 아닙니다. 자세한 내용은 이용 약관을 참조하세요.