PROTECTED SOURCE SCRIPT
업데이트됨 RVI SD Band Oscillator | BinMasta
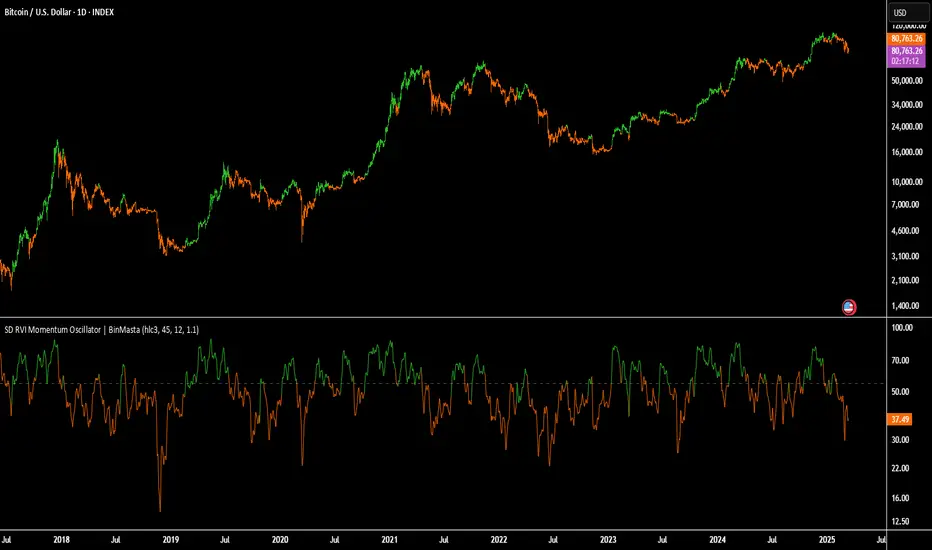
The RVI SD Band Oscillator is a momentum-based indicator that enhances trend analysis using the Relative Vigor Index (RVI) with Standard Deviation (SD) Bands. It refines signals by incorporating a signal line and dynamically adjusting bands based on market volatility.
Core Components:
RVI Calculation: Measures price momentum relative to past movements.
Signal Line: A smoothed version of RVI to identify crossovers.
SD Bands: Standard deviation-based boundaries to gauge overbought/oversold conditions.
Trading Logic:
Trend Direction: Determined by RVI crossover with the signal line.
Momentum Confirmation: Identifies shifts in buying and selling strength.
Trade Signals:
Bullish when the trend is up & the signal is near the lower band.
Bearish when the trend is down & the signal is near the upper band.
Visual Features:
Colored candles highlight potential trend shifts.
Signal line plot provides additional confirmation.
Disclaimer:
This indicator is for educational purposes only and should not be considered financial advice. Past performance is not indicative of future results. Always conduct your own analysis and risk management before making trading decisions. 🚀
릴리즈 노트
The RVI SD Band Oscillator is a momentum-based indicator that enhances trend analysis using the Relative Vigor Index (RVI) with Standard Deviation (SD) Bands. It refines signals by incorporating a signal line and dynamically adjusting bands based on market volatility.Core Components:
RVI Calculation: Measures price momentum relative to past movements.
Signal Line: A smoothed version of RVI to identify crossovers.
SD Bands: Standard deviation-based boundaries to gauge overbought/oversold conditions.
Trading Logic:
Trend Direction: Determined by RVI crossover with the signal line.
Momentum Confirmation: Identifies shifts in buying and selling strength.
Trade Signals:
Bullish when the trend is up & the signal is near the lower band.
Bearish when the trend is down & the signal is near the upper band.
Visual Features:
Colored candles highlight potential trend shifts.
Signal line plot provides additional confirmation.
Disclaimer:
This indicator is for educational purposes only and should not be considered financial advice. Past performance is not indicative of future results. Always conduct your own analysis and risk management before making trading decisions. 🚀
보호된 스크립트입니다
이 스크립트는 비공개 소스로 게시됩니다. 하지만 이를 자유롭게 제한 없이 사용할 수 있습니다 – 자세한 내용은 여기에서 확인하세요.
면책사항
해당 정보와 게시물은 금융, 투자, 트레이딩 또는 기타 유형의 조언이나 권장 사항으로 간주되지 않으며, 트레이딩뷰에서 제공하거나 보증하는 것이 아닙니다. 자세한 내용은 이용 약관을 참조하세요.
면책사항
해당 정보와 게시물은 금융, 투자, 트레이딩 또는 기타 유형의 조언이나 권장 사항으로 간주되지 않으며, 트레이딩뷰에서 제공하거나 보증하는 것이 아닙니다. 자세한 내용은 이용 약관을 참조하세요.