PROTECTED SOURCE SCRIPT
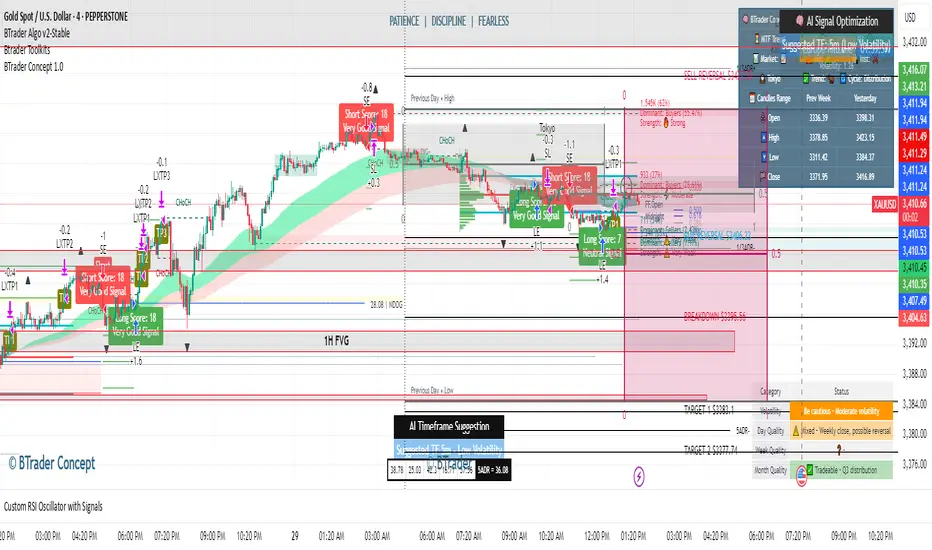
Custom RSI Oscillator with Signals
//version=5
indicator("Custom RSI Oscillator", overlay=false)
// Inputs
length = input.int(14, "RSI Length")
overbought = input.int(70, "Overbought Level")
oversold = input.int(30, "Oversold Level")
// RSI Calculation
rsiValue = ta.rsi(close, length)
// Plot RSI
plot(rsiValue, color=color.blue, linewidth=2, title="RSI")
// Levels
hline(overbought, "Overbought", color=color.red)
hline(oversold, "Oversold", color=color.green)
hline(50, "Midline", color=color.gray)
// Background Highlights
bgcolor(rsiValue > overbought ? color.new(color.red, 85) : na)
bgcolor(rsiValue < oversold ? color.new(color.green, 85) : na)
보호된 스크립트입니다
이 스크립트는 비공개 소스로 게시됩니다. 하지만 제한 없이 자유롭게 사용할 수 있습니다 — 여기에서 자세히 알아보기.
면책사항
이 정보와 게시물은 TradingView에서 제공하거나 보증하는 금융, 투자, 거래 또는 기타 유형의 조언이나 권고 사항을 의미하거나 구성하지 않습니다. 자세한 내용은 이용 약관을 참고하세요.
보호된 스크립트입니다
이 스크립트는 비공개 소스로 게시됩니다. 하지만 제한 없이 자유롭게 사용할 수 있습니다 — 여기에서 자세히 알아보기.
면책사항
이 정보와 게시물은 TradingView에서 제공하거나 보증하는 금융, 투자, 거래 또는 기타 유형의 조언이나 권고 사항을 의미하거나 구성하지 않습니다. 자세한 내용은 이용 약관을 참고하세요.