PROTECTED SOURCE SCRIPT
업데이트됨 Sri - Daily & Weekly Candle Strength
Sri - Daily & Weekly Candle Strength
Short Title: Sri-Candle
Overlay: Yes
Description:
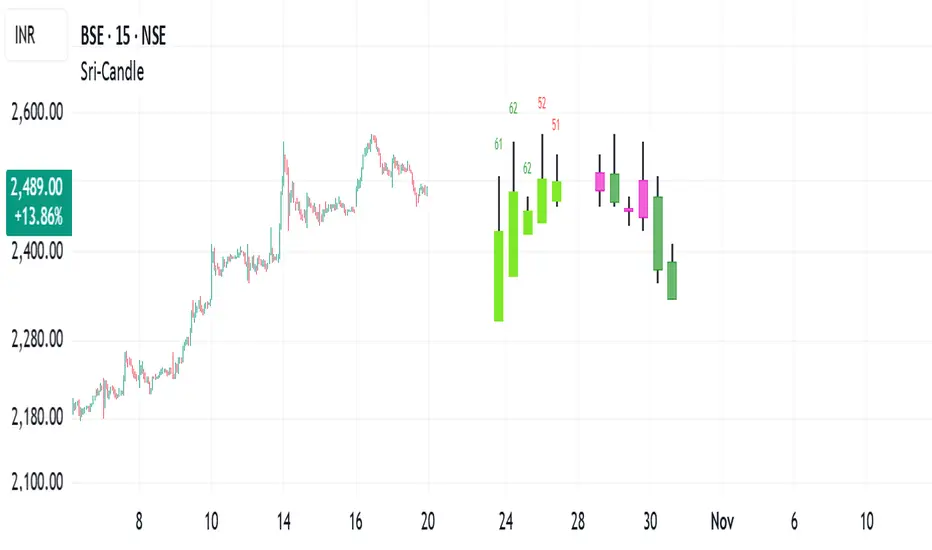
The Sri - Daily & Weekly Candle Strength indicator is designed to visually display recent daily and weekly candle activity directly on your chart, highlighting buyer and seller dominance for each candle. It helps traders quickly assess the strength of bullish vs bearish pressure over recent periods and can be used with both Normal and Heikin Ashi candles. This tool is particularly useful for swing traders, position traders, and technical analysts who want a clear view of candle momentum without switching timeframes.
Features:
Multi-Timeframe Candles:
Displays the last several daily candles and weekly candles on your chart.
Supports Normal or Heikin Ashi candles for both daily and weekly views.
Candle Strength Analysis:
Calculates buyer strength and seller strength as percentages based on candle body relative to the total candle range.
Highlights the dominant strength (higher of buyer or seller) above each candle.
Option to round dominant strength percentages to whole numbers.
Customizable Colors:
Set separate bullish and bearish colors for daily and weekly candles.
Customize wick colors independently for daily and weekly candles.
Positioning and Layout Options:
Adjust horizontal offset, candle thickness, and gap between candles for both daily and weekly candles.
Choose label positions for date labels (Top, Bottom, Absolute level).
Flexible Text Display:
Choose label text size (Tiny, Small, Normal, Large, Huge).
Daily candles display the day of the month on the candle optionally.
Dynamic Candle Rendering:
Each candle is plotted as a box with wicks, accurately reflecting open, high, low, and close.
Dominant strength percentage label is colored green for bullish dominance and red for bearish dominance.
Inputs:
Daily Settings:
Show Daily Candles – Toggle daily candle visibility.
Daily Candle Type – Choose between Normal or Heikin Ashi.
Daily Timeframe – Select Daily (D), Weekly (W), or Monthly (M).
Bull Candle Color (D) – Color for bullish daily candles.
Bear Candle Color (D) – Color for bearish daily candles.
Wick Color (D) – Color for candle wicks.
Horizontal Offset (D) – Distance from current bar to start drawing.
Candle Thickness (D) – Width of candle boxes.
Gap Between Candles (D) – Space between consecutive candles.
Daily Label Position – Position for the date label.
Absolute Level – Y-axis level when using absolute label position.
Strength Label Text Size – Size of the dominant strength label.
Round Dominant % (No Decimals) – Round the displayed strength to whole numbers.
Weekly Settings:
Show Weekly Candles – Toggle weekly candle visibility.
Weekly Candle Type – Choose Normal or Heikin Ashi.
Weekly Timeframe – Select Daily (D), Weekly (W), or Monthly (M).
Bull Candle Color (W) – Color for bullish weekly candles.
Bear Candle Color (W) – Color for bearish weekly candles.
Wick Color (W) – Wick color for weekly candles.
Horizontal Offset (W) – Distance from current bar for weekly candles.
Candle Thickness (W) – Width of weekly candle boxes.
Gap Between Candles (W) – Space between consecutive weekly candles.
How It Works:
The script fetches candle data using the request.security() function for the selected timeframe and type (Normal or Heikin Ashi).
Each candle’s buyer and seller strength is calculated as:
Buyer Strength (%) = ((Close - Low) / (High - Low)) * 100
Seller Strength (%) = ((High - Close) / (High - Low)) * 100
Candles are drawn as boxes with wicks on the chart at the specified horizontal offset.
The dominant strength is displayed above each candle, colored green for bullish dominance or red for bearish dominance.
Daily candles can optionally show the day of the month as a label.
Use Cases:
Quickly identify recent bullish or bearish trends on daily and weekly timeframes.
Compare strength of buyers vs sellers across multiple periods.
Combine with other technical indicators for multi-timeframe analysis.
Short Title: Sri-Candle
Overlay: Yes
Description:
The Sri - Daily & Weekly Candle Strength indicator is designed to visually display recent daily and weekly candle activity directly on your chart, highlighting buyer and seller dominance for each candle. It helps traders quickly assess the strength of bullish vs bearish pressure over recent periods and can be used with both Normal and Heikin Ashi candles. This tool is particularly useful for swing traders, position traders, and technical analysts who want a clear view of candle momentum without switching timeframes.
Features:
Multi-Timeframe Candles:
Displays the last several daily candles and weekly candles on your chart.
Supports Normal or Heikin Ashi candles for both daily and weekly views.
Candle Strength Analysis:
Calculates buyer strength and seller strength as percentages based on candle body relative to the total candle range.
Highlights the dominant strength (higher of buyer or seller) above each candle.
Option to round dominant strength percentages to whole numbers.
Customizable Colors:
Set separate bullish and bearish colors for daily and weekly candles.
Customize wick colors independently for daily and weekly candles.
Positioning and Layout Options:
Adjust horizontal offset, candle thickness, and gap between candles for both daily and weekly candles.
Choose label positions for date labels (Top, Bottom, Absolute level).
Flexible Text Display:
Choose label text size (Tiny, Small, Normal, Large, Huge).
Daily candles display the day of the month on the candle optionally.
Dynamic Candle Rendering:
Each candle is plotted as a box with wicks, accurately reflecting open, high, low, and close.
Dominant strength percentage label is colored green for bullish dominance and red for bearish dominance.
Inputs:
Daily Settings:
Show Daily Candles – Toggle daily candle visibility.
Daily Candle Type – Choose between Normal or Heikin Ashi.
Daily Timeframe – Select Daily (D), Weekly (W), or Monthly (M).
Bull Candle Color (D) – Color for bullish daily candles.
Bear Candle Color (D) – Color for bearish daily candles.
Wick Color (D) – Color for candle wicks.
Horizontal Offset (D) – Distance from current bar to start drawing.
Candle Thickness (D) – Width of candle boxes.
Gap Between Candles (D) – Space between consecutive candles.
Daily Label Position – Position for the date label.
Absolute Level – Y-axis level when using absolute label position.
Strength Label Text Size – Size of the dominant strength label.
Round Dominant % (No Decimals) – Round the displayed strength to whole numbers.
Weekly Settings:
Show Weekly Candles – Toggle weekly candle visibility.
Weekly Candle Type – Choose Normal or Heikin Ashi.
Weekly Timeframe – Select Daily (D), Weekly (W), or Monthly (M).
Bull Candle Color (W) – Color for bullish weekly candles.
Bear Candle Color (W) – Color for bearish weekly candles.
Wick Color (W) – Wick color for weekly candles.
Horizontal Offset (W) – Distance from current bar for weekly candles.
Candle Thickness (W) – Width of weekly candle boxes.
Gap Between Candles (W) – Space between consecutive weekly candles.
How It Works:
The script fetches candle data using the request.security() function for the selected timeframe and type (Normal or Heikin Ashi).
Each candle’s buyer and seller strength is calculated as:
Buyer Strength (%) = ((Close - Low) / (High - Low)) * 100
Seller Strength (%) = ((High - Close) / (High - Low)) * 100
Candles are drawn as boxes with wicks on the chart at the specified horizontal offset.
The dominant strength is displayed above each candle, colored green for bullish dominance or red for bearish dominance.
Daily candles can optionally show the day of the month as a label.
Use Cases:
Quickly identify recent bullish or bearish trends on daily and weekly timeframes.
Compare strength of buyers vs sellers across multiple periods.
Combine with other technical indicators for multi-timeframe analysis.
릴리즈 노트
Sri - Daily & Weekly Candle StrengthShort Title: Sri-Candle
Overlay: Yes
Description:
The Sri - Daily & Weekly Candle Strength indicator is designed to visually represent recent daily and weekly candle activity directly on your chart, highlighting bullish and bearish dominance for each candle. It provides traders with a clear view of price momentum across multiple timeframes without the need to switch charts. The indicator supports both Normal and Heikin Ashi candles and is highly configurable for color, position, and display style. This makes it ideal for swing traders, position traders, and technical analysts who want a quick assessment of buyer vs. seller pressure.
Features:
Multi-Timeframe Candle Display
Displays the most recent daily and weekly candles directly on your chart.
Supports Normal and Heikin Ashi candle types for both daily and weekly views.
Daily candles are plotted oldest to newest, while weekly candles are plotted in a configurable horizontal offset.
Candle Strength Analysis
Calculates buyer strength and seller strength as percentages relative to the total candle range:
Buyer Strength (%) = ((Close − Low) / (High − Low)) × 100
Seller Strength (%) = ((High − Close) / (High − Low)) × 100
Dominant strength is displayed above each candle in green for bullish dominance and red for bearish dominance.
Option to round dominant strength percentages to whole numbers.
Customizable Colors
Set bullish and bearish colors separately for daily and weekly candles.
Customize wick colors independently for daily and weekly candles.
Positioning & Layout Options
Adjustable horizontal offset, candle thickness, and gap between candles for both daily and weekly timeframes.
Daily candles optionally display the day of the month as a label.
Weekly candles can be offset to avoid overlapping daily candles.
Flexible Text Display
Label text sizes: Tiny, Small, Normal, Large, Huge.
Strength labels are displayed with a transparent background to keep the chart clean.
Dynamic Candle Rendering
Each candle is drawn as a box with wicks that accurately reflects Open, High, Low, and Close.
Dominant strength labels are placed slightly above the high of each candle for clarity.
Inputs
Daily Settings
Show Daily Candles: Toggle visibility.
Candle Type: Normal or Heikin Ashi.
Daily Timeframe: D (Daily), W (Weekly), or M (Monthly).
Bull/Bear Candle Color: Separate colors for bullish and bearish daily candles.
Wick Color: Independent wick color.
Horizontal Offset: Distance from current bar.
Candle Thickness: Width of daily candle boxes.
Gap Between Candles: Space between consecutive candles.
Number of Candles to Show: 1 to 10.
Strength Label Text Size: Tiny → Huge.
Round Dominant %: Option to show whole numbers.
Weekly Settings
Show Weekly Candles: Toggle visibility.
Candle Type: Normal or Heikin Ashi.
Weekly Timeframe: D, W, or M.
Bull/Bear Candle Color: Separate colors for bullish and bearish weekly candles.
Wick Color: Independent wick color.
Horizontal Offset: Distance from current bar.
Candle Thickness: Width of weekly candle boxes.
Gap Between Candles: Space between consecutive candles.
How It Works
The script fetches candle data using request.security() for the selected timeframe and type.
Each candle’s buyer and seller strength is calculated and displayed.
Candles are drawn as boxes with wicks using customizable colors and positions.
Dominant strength percentage labels are displayed above each candle.
Daily candles optionally show the day of the month.
Weekly candles are drawn in a horizontal sequence next to daily candles with proper spacing.
Use Cases
Quickly identify recent bullish or bearish trends on daily and weekly timeframes.
Compare buyer vs seller strength across multiple periods.
Combine with other technical indicators for multi-timeframe trend analysis.
Ideal for swing trading, position trading, and technical analysis without switching timeframes.
보호된 스크립트입니다
이 스크립트는 비공개 소스로 게시됩니다. 하지만 이를 자유롭게 제한 없이 사용할 수 있습니다 – 자세한 내용은 여기에서 확인하세요.
면책사항
해당 정보와 게시물은 금융, 투자, 트레이딩 또는 기타 유형의 조언이나 권장 사항으로 간주되지 않으며, 트레이딩뷰에서 제공하거나 보증하는 것이 아닙니다. 자세한 내용은 이용 약관을 참조하세요.
면책사항
해당 정보와 게시물은 금융, 투자, 트레이딩 또는 기타 유형의 조언이나 권장 사항으로 간주되지 않으며, 트레이딩뷰에서 제공하거나 보증하는 것이 아닙니다. 자세한 내용은 이용 약관을 참조하세요.