OPEN-SOURCE SCRIPT
업데이트됨 Abhi's Bollinger Band Reversal Signal
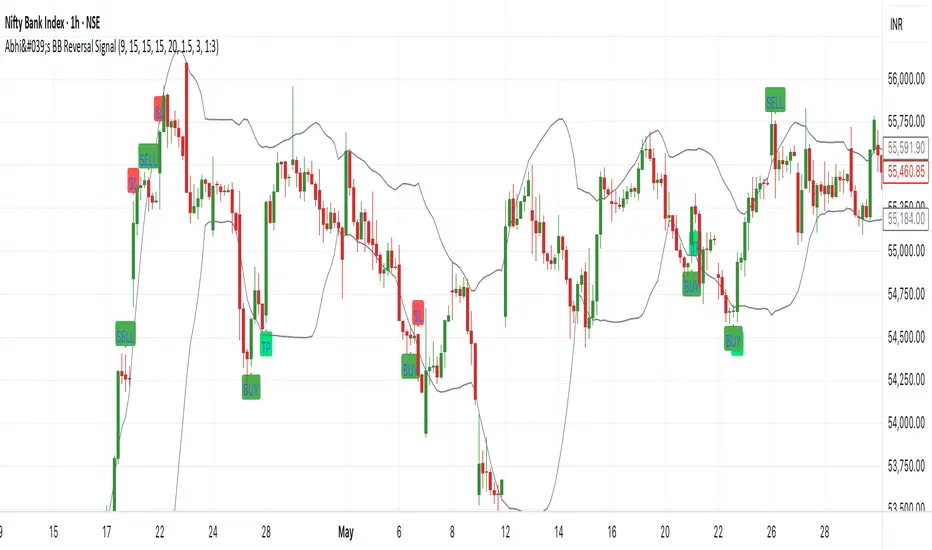
This Pine Script indicator is designed to detect reversal trade opportunities using Bollinger Band breakouts. It identifies both buy and sell setups with clearly defined entry, stop-loss (SL), and target (TP) conditions. It also manages trades visually with real-time signal plotting, and limits entries per trading day.
⚙️ How It Works
🔽 Sell Signal Conditions
- The previous candle must close above the upper Bollinger Band, and its entire body must be above the band
- The current candle must fail to break the previous high, and must break below the previous low
- Entry is taken at the previous candle’s low, with SL at its high
- Target is calculated based on a configurable Risk:Reward ratio
🔼 Buy Signal Conditions
- The previous candle must close below the lower Bollinger Band, and its entire body must be below the band
- The current candle must fail to break the previous low, and must break above the previous high
- Entry is at the previous candle’s high, with SL at its low
- Target is calculated using the same Risk:Reward ratio
⏰ Time-Based Exit
- If a trade is still active by a user-defined exit time (e.g. 15:15), the trade is closed
- Labels are plotted to show whether this exit was a profit or loss
🧩 User Inputs
- Start Time for signals
- Exit Time for open trades
- Bollinger Band Settings: Period and Std Dev
- Max Entries Per Day
- Risk:Reward Ratio: Dropdown for 1:1, 1:1.5, ..., 1:3
🎨 Visual Features
✅ BUY and SELL signals are plotted when valid conditions are detected
🟢 TP and 🔴 SL labels show trade outcome
🕒 TIME EXIT labels appear at user-set exit time with green/red coloring based on profitability
📉 Bollinger Bands plotted for visual context
📌 Notes:
- Designed for intraday trading, resets entry counter daily
- Uses bar_index > tradeBarIndex to avoid SL/TP being triggered on the same candle as entry
- Tracks only one trade at a time (tradeActive) — ensures clear, non-overlapping logic
릴리즈 노트
This indicator detects potential mean-reversion trades using Bollinger Band breakout and reversal patterns. It:- Identifies Buy signals when price closes below the lower Bollinger Band and then forms a strong bullish candle
- Identifies Sell signals when price closes above the upper Bollinger Band and then reverses bearishly
- Supports configurable Risk:Reward ratios (1:1 to 1:4) with automatic Take Profit and Stop Loss plotting
- Switches between Intraday mode (exits at end of day if time frame is <=30 mins) and CNC mode (multi-day trades if time frame is > 30mins) based on chart timeframe
- Limits number of entries per day to avoid overtrading
- Displays clear labels for entry, SL/TP hits, and time exits
- Includes alert conditions for automation or webhook-based notification
오픈 소스 스크립트
트레이딩뷰의 진정한 정신에 따라, 이 스크립트의 작성자는 이를 오픈소스로 공개하여 트레이더들이 기능을 검토하고 검증할 수 있도록 했습니다. 작성자에게 찬사를 보냅니다! 이 코드는 무료로 사용할 수 있지만, 코드를 재게시하는 경우 하우스 룰이 적용된다는 점을 기억하세요.
면책사항
해당 정보와 게시물은 금융, 투자, 트레이딩 또는 기타 유형의 조언이나 권장 사항으로 간주되지 않으며, 트레이딩뷰에서 제공하거나 보증하는 것이 아닙니다. 자세한 내용은 이용 약관을 참조하세요.
오픈 소스 스크립트
트레이딩뷰의 진정한 정신에 따라, 이 스크립트의 작성자는 이를 오픈소스로 공개하여 트레이더들이 기능을 검토하고 검증할 수 있도록 했습니다. 작성자에게 찬사를 보냅니다! 이 코드는 무료로 사용할 수 있지만, 코드를 재게시하는 경우 하우스 룰이 적용된다는 점을 기억하세요.
면책사항
해당 정보와 게시물은 금융, 투자, 트레이딩 또는 기타 유형의 조언이나 권장 사항으로 간주되지 않으며, 트레이딩뷰에서 제공하거나 보증하는 것이 아닙니다. 자세한 내용은 이용 약관을 참조하세요.