OPEN-SOURCE SCRIPT
Whalemap [BigBeluga]
The Whalemap indicator aims to spot big buying and selling activity represented as big orders for a possible bottom or top formation on the chart.
🔶 CALCULATION
The indicator uses volume to spot big volume activity represented as big orders in the market.
Pine Script®
When volume exceeds its own threshold, it is a sign that volume is exceeding its normal value and is considered as a "Whale order" or "Whale activity," which is then plotted on the chart as circles.
🔶 DETAILS

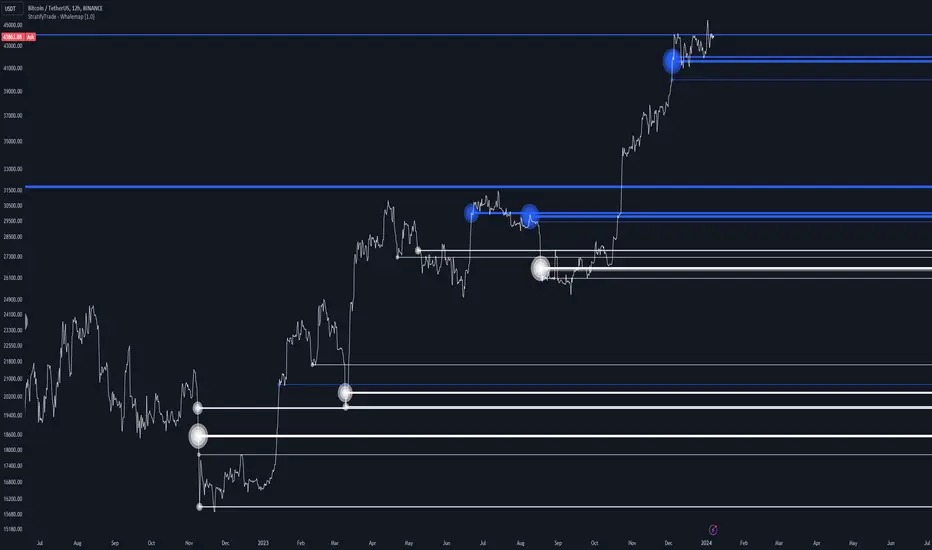
The indicator plots Bubbles on the chart with different sizes indicating the buying or selling activity. The bigger the circle, the more impact it will have on the market.
On each circle is also plotted a line, and its own weight is also determined by the strength of its own circle; the bigger the circle, the bigger the line.

Old buying/selling activity can also be used for future support and resistance to spot interesting areas.
The more price enters old buying/selling activity and starts producing orders of the same direction, it might be an interesting point to take a closer look.
🔶 EXAMPLES


The chart above is showing us price reacting to big orders, finding good bottoms in price and good tops in confluence with old activity.
🔶 SETTINGS
Users will have the options to:
🔶 CALCULATION
The indicator uses volume to spot big volume activity represented as big orders in the market.
for i = 0 to len - 1
blV.vol += (close > close[i + 1] ? volume : 0)
brV.vol += (close < close[i + 1] ? volume : 0)
When volume exceeds its own threshold, it is a sign that volume is exceeding its normal value and is considered as a "Whale order" or "Whale activity," which is then plotted on the chart as circles.
🔶 DETAILS
The indicator plots Bubbles on the chart with different sizes indicating the buying or selling activity. The bigger the circle, the more impact it will have on the market.
On each circle is also plotted a line, and its own weight is also determined by the strength of its own circle; the bigger the circle, the bigger the line.
Old buying/selling activity can also be used for future support and resistance to spot interesting areas.
The more price enters old buying/selling activity and starts producing orders of the same direction, it might be an interesting point to take a closer look.
🔶 EXAMPLES
The chart above is showing us price reacting to big orders, finding good bottoms in price and good tops in confluence with old activity.
🔶 SETTINGS
Users will have the options to:
- Filter options to adjust buying and selling sensitivity.
- Display/Hide Lines
- Display/Hide Bubbles
- Choose which orders to display (from smallest to biggest)
오픈 소스 스크립트
트레이딩뷰의 진정한 정신에 따라, 이 스크립트의 작성자는 이를 오픈소스로 공개하여 트레이더들이 기능을 검토하고 검증할 수 있도록 했습니다. 작성자에게 찬사를 보냅니다! 이 코드는 무료로 사용할 수 있지만, 코드를 재게시하는 경우 하우스 룰이 적용된다는 점을 기억하세요.
🔵Gain access to our powerful tools : bigbeluga.com/tv
🔵Join our free discord for updates : bigbeluga.com/discord
All scripts & content provided by BigBeluga are for informational & educational purposes only.
🔵Join our free discord for updates : bigbeluga.com/discord
All scripts & content provided by BigBeluga are for informational & educational purposes only.
면책사항
해당 정보와 게시물은 금융, 투자, 트레이딩 또는 기타 유형의 조언이나 권장 사항으로 간주되지 않으며, 트레이딩뷰에서 제공하거나 보증하는 것이 아닙니다. 자세한 내용은 이용 약관을 참조하세요.