PROTECTED SOURCE SCRIPT
업데이트됨 BTC Market Top and Bottom
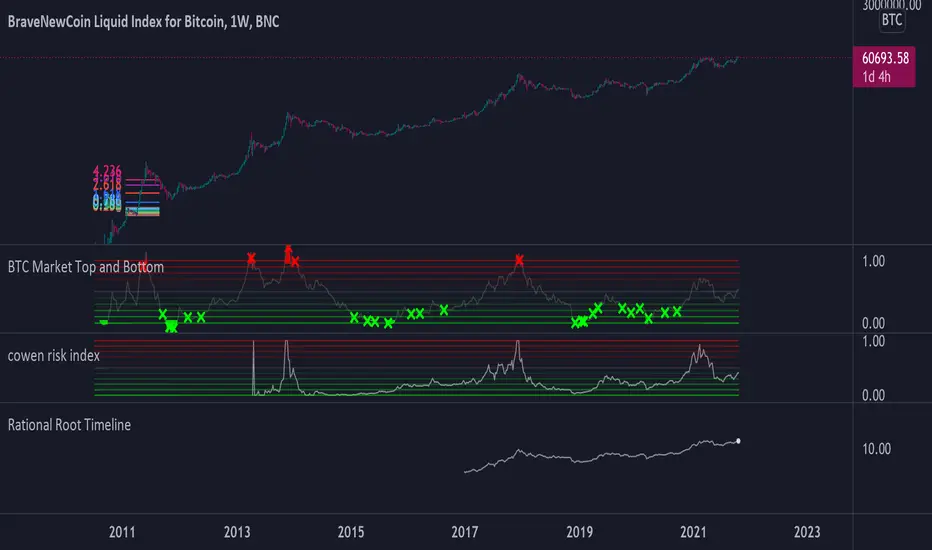
This script is a logarithmic moving average oscillator for the daily BTC chart (Or any asset ideally with data more than 4 years in length) to help find the top and bottom of the entire cycle. The idea is to buy when the oscillator is near green and sell when things are near the red. Should be used in conjunction with shorter timeframe indicators to find your best entries. This just shows the overall position of the cycle.
Instructions:
Use on a Daily BTCUSD chart or BLX chart. The more data the better.
Adjust the length to around 1000-1500 (this mainly controls the green line)
Adjust the denominator (this mainly controls the red line)
Adjust the smoothness (for visual appeal and noise reduction)
Instructions:
Use on a Daily BTCUSD chart or BLX chart. The more data the better.
Adjust the length to around 1000-1500 (this mainly controls the green line)
Adjust the denominator (this mainly controls the red line)
Adjust the smoothness (for visual appeal and noise reduction)
릴리즈 노트
Converted to security function to show Daily on all timeframes. Changed signal line to a function to allow for an incrementing sma inside the security function. 릴리즈 노트
Added a momentum function to the signal. This should help spot when the momentum is potentially reversing when the signal is higher than momentum top and less than momentum bottom. You can adjust them in the settings.릴리즈 노트
Added risk levels보호된 스크립트입니다
이 스크립트는 비공개 소스로 게시됩니다. 하지만 이를 자유롭게 제한 없이 사용할 수 있습니다 – 자세한 내용은 여기에서 확인하세요.
면책사항
해당 정보와 게시물은 금융, 투자, 트레이딩 또는 기타 유형의 조언이나 권장 사항으로 간주되지 않으며, 트레이딩뷰에서 제공하거나 보증하는 것이 아닙니다. 자세한 내용은 이용 약관을 참조하세요.
면책사항
해당 정보와 게시물은 금융, 투자, 트레이딩 또는 기타 유형의 조언이나 권장 사항으로 간주되지 않으며, 트레이딩뷰에서 제공하거나 보증하는 것이 아닙니다. 자세한 내용은 이용 약관을 참조하세요.